JOURNAL OF COSMETIC SCIENCE 164 Consumer test. A total of 63 female consumers of cosmetic creams aged between 21 and 72 were recruited randomly in shopping areas, university facilities, and other public places in Montevideo, Uruguay. Taking into account the areas where the respondents were re- cruited, the sample was assumed to represent the general Uruguayan middle-income groups. The test was conducted at the site of recruitment, exercising care to avoid odor contamination and to create the conditions for respondents to perform the test in a re- laxed atmosphere. Respondents were presented with 20 g each of the six cream samples in white plastic cups coded with three-digit random numbers. The sequential monadic sample pre- sentation protocol was used, using a different random presentation order for each respondent. The respondents were asked to remove the cup lids, smell each cream sample, and rate it according to overall liking on a 9-point structured hedonic scale ranging from extreme dislike to extreme liking, and intention to purchase on a 9-point structured hedonic scale ranging from defi nite unwillingness to defi nite intention to purchase. No information about the name of the sample fragrance was provided to the respondents. Finally, the respondents answered a CATA question consisting of a list of 32 terms from which they selected those applicable to each of the six samples they had smelled. The CATA terms could be classifi ed into the following categories: Odor: delicious, disagreeable, strong, mild Affective: must-have, glamorous, for pampering oneself, energizing Effect of cream on the skin: nourishing, moisturizing, softening, beautifying, anti-aging, anti-wrinkle Price: cheap, expensive Target market: young women, older women, exclusive, mass market Zones of application: feet, hands, face, body Occasions of use: summer, winter, day, night Other: fresh, healthy, natural, artifi cial Respondents also completed a brief survey of sociodemographic data (age, marital status, number of persons in the household, number of children in the household, and highest educational level attained). They were also asked about their consumption frequency of face creams (moisturizing, nourishing, and anti-aging) and body creams (moisturizing, nourishing, anti-aging, slimming, and toning creams) with structured answers (three op- tions): never, sometimes, or always used. Data analysis. An analysis of variance (ANOVA) was performed on the overall liking and intention to purchase data using sample as the variation factor. Signifi cant differences between means were determined according to the Tukey test (p ≤ 0.05). CATA question. For the CATA question, frequency of mention by respondents was counted for each attribute and sample. To detect differences in consumers’ perception of the eval- uated fragrances, Cochran’s Q test was carried out for each of the 32 terms considering sample and consumer as variation factors. Cochran’s Q test is a non-parametric statistical test used in the analysis of two-way randomized block designs to determine whether k treatments have identical effects when the response variable is binary.

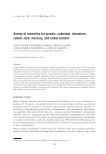
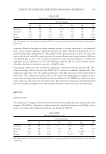
SELECTION OF FRAGRANCE FOR COSMETIC CREAM CONTAINING OLIVE OIL 165 Cluster analysis. Hierarchical cluster analysis of overall liking data enabled the identifi ca- tion of two consumer groups with different overall attitudes toward the tested products. The formation of clusters was based on Ward’s aggregation criterion and the calculation of Euclidean distances between data points. The chi-square statistical test was performed to determine signifi cant differences (p ≤ 0.05) in the distribution frequency of sociodemo- graphic variables and in cosmetic cream consumption frequency between clusters. An ANOVA was conducted on overall liking, considering sample, cluster, and a combi- nation of the two, as variation factors. Mean ratings and honestly signifi cant differences were determined based on the Tukey test (p ≤ 0.05). For the CATA questions, frequency of mention was determined for each term and cluster, and Cochran’s Q test was carried out for each term to determine whether the consumers in the two clusters used the terms in signifi cantly different ways. Finally, correspondence analysis—a descriptive/exploratory technique designed to ana- lyze simple two-way contingence tables showing a certain degree of correspondence be- tween rows and columns—enabled a spatial representation of the data, refl ecting the relationship between the stimuli and the elicited concepts (23). XL-Stat 2012 (Addinsoft, New York, NY) was used to conduct the above analysis. RESULTS AND DISCUSSION Table II shows the sociodemographic characteristics of respondents and the frequency of cosmetic cream use among these consumers. Table II Sociodemographic Characteristics and Cosmetic Cream Use Frequency (n = 63) Age (years old) ≤35 28 (44.4%) Over 35 35 (55.6%) Education level Secondary education completed 18 (28.6%) Partial tertiary education 19 (32.2%) University graduates 26 (41.2%) Marital status Lives with a partner 18 (28.6%) Lives alone 45 (71.4%) Number of persons in the household 1–2 34 (54.0%) 3 or more 29 (46.0%) Number of children in the household 0 52 (82.5%) 1 or more 11 (17.5%) Face cream use frequency Occasional use 12 (19.0%) Frequent use 39 (62.0%) Always uses 12 (19.0%) Body cream use frequency Occasional use 17 (27.0%) Frequent use 39 (61.9%) Always uses 7 (11.1%)
Purchased for the exclusive use of nofirst nolast (unknown)
From: SCC Media Library & Resource Center (library.scconline.org)