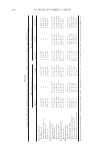
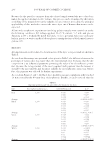
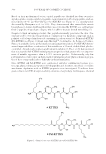
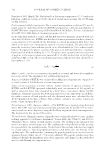
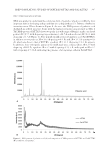
JOURNAL OF COSMETIC SCIENCE 306 PARTITIONING AND SOLUBILITY Partition coeffi cient is a d e termining property which af fects the permeation of a permeant across the skin. The experimental logP value of KTTKS, obtained through the shake fl ask method, was -1.6 ± 0.15. We could not determine logP of Pal-KTTKS experimentally be cause this molecule ap- parently self-aggregates in n-octanol–saturated water even at low concentrations (as low as 25 μg/mL). The same problem occurred when n-hexadecane was used as the oily phase. Lower concentrations were not used because of detection limitations. In such situations, formulators can use different software, such as ACD/ChemSketch, to calculate logP. The calculated logP (clogP) of Pal-KTTKS obtained here by this software was found to be 3.7 (11). Therefore, it could be concluded that the peptide conjugate Pal-KTTKS is much more lipophilic than KTTKS (logP = -1.6) and might be a better candidate for skin permeation than KTTKS. Such a compound might even get trapped in the lipid domain of the stratum corneum. Such a lipophilic molecule is expected to be soluble in lipophilic vehicles, such as ointments or oily phase of o/w and w/o emulsions and creams. KTTKS aqueous solubility was estimated to exceed 220 mg/mL, w hich is considered as freely soluble. However, we were unable to determine the solubility of Pal-KTTKS be- cause of its complex behavior in aqueous systems possibly due to its self-aggregation and assembly. Solubility estimation by ALOGPS revealed an aqueous solubility of 0.02 mM (0.016 mg/mL) for Pal-KTTKS, in good agreement with CMC value obtained by the ring method, as discussed later. SURFACE TENSION MEASUREMENT OF PEPTIDE SOLUTIONS Theoretical and experimental surface tensions of both peptide s as well as deionized water obtained by ACD-ChemSketch software and the ring method, respectively, are pro- vided in Table II. The experimental surface tension of KTTKS aqueous solution was Table II Theoretical and Experimental Surface Tensions of Deionized Water, KTTKS, and Pal-KTTKS Theoretical surface tension (mN/m) Experimental surface tension (mN/m) (n = 3) Deionized water 72.2 ± 3 70.8 ± 0.05 KTTKS 63.1 ± 3 69.0 ± 2.7 Pal-KTTKS 50.1 ± 3 50.3 ± 0.4 Table I Summary of XRD Patterns of Palmitic A cid at Ambient Temperature 2θ (degree) Repeat distance (Å) Relative intensity (%) 2.6 34.6 6.2 7.5 11.7 17.5 20.5 4.3 5.9 21.7 4.1 100 24.3 3.7 18.6 30.3 2.9 4.4

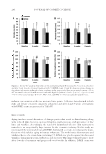
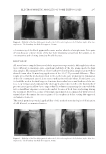
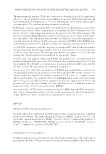
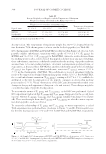
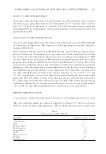
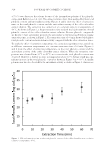
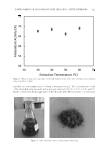
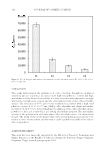
PREFORMULATION STUDIES OF PEPTIDES KTTKS AND PAL-KTTKS 307 69.0 ± 2.7 mN/m, which is almost identical to the surface tension of water (70.8 ± 0.05 mN/m) (p 0.05, independent sample t-test). For aqueous solution of Pal-KTTKS, the surface tension was reduced signifi cantly to 50.3 ± 0.4 mN/m (p 0.05, independent sample t-test), indicating that this peptide possesses surface activity. These data agree with the surface tension obtained using software, which was 50.1 ± 3 mN/m. DETERMINATION OF CMC Because of surface activity, the CMC value o f Pal-KTTKS aqueous s olution was deter- mined by the ring method and found to be 0.024 ± 0.004 mM as will be discussed later, such activity is expected based on the amphiphilic behavior of Pal-KTTKS. THERMAL BEHAVIOR Thermal behavior and stability of peptides are im portant issues du ring formulation, stor- age, and permeation studies of these molecules. Hence, thermal behaviors of KTTKS and Pal-KTTKS were investigated here. The results obtained from the melting apparatus demonstrated that both peptides decomposed before melting. Their decomposition tem- peratures were observed at 154 and 150°C for KTTKS and Pal-KTTKS, respectively. The TGA and the first derivative TGA thermograms of KTTKS and Pal-KT TKS are shown in Figure 5A and B and results summarized in Table III. There are three distinct weight loss areas in TGA thermograms for both peptides. Based on the results of the melting point apparatus, DSC (as explained in the following paragraph), and data ob- tained from the TGA analysis, it could be said that the fi rst weight loss area in the TGA thermograms of KTTKS and Pal-KTTKS (25–150°C) could be probably attributed to evaporation of water, as explained later. The second and third weight loss areas (150–250 and 250–595°C), where more weight loss has occurred, are presumably relevant to peptide Figure 5. TGA thermograms a n d their first derivatives for KTTKS (A) and Pal-KTTKS (B) at a heating rate of 10°C/min over 25–595°C (n = 3), and also heating–cooling–heating cycle TGA thermograms of KTTKS (C) and Pal-KTTKS (D) at a heating rate of 5°C/min over 25–100°C.
Purchased for the exclusive use of nofirst nolast (unknown)
From: SCC Media Library & Resource Center (library.scconline.org)