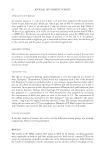
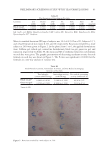
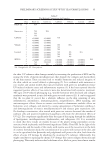
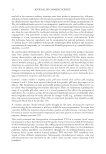
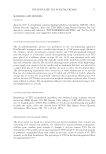
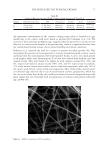
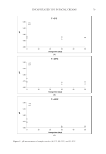
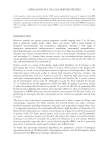
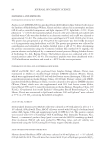
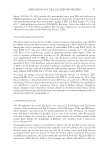
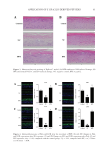
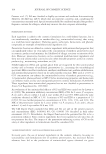
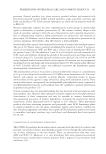
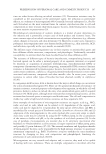
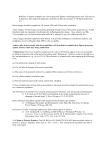
89 APPLICATION OF E GRACILIS-DERIVED PEPTIDES TRANSCRIPTOME ANALYSIS Transcriptome analysis was performed to reveal the changes in gene expression of RAW 264.7 cells under the function of BPE. Herein, LPS was used to induce the inflammatory response of cells, and dexamethasone treatment was applied as the positive control. As shown in Figure 2, LPS simulation induced specific changes in gene expression, characterized with 1,215 upregulated genes and 809 downregulated genes in the negative groups. Among these genes, inflammation- and immune response-related genes such as tumor necrosis factor superfamily member 10 (TNFSF10), interferon-induced protein 44-like gene (IFI44L), discs large homolog 5 (DLG5), and calcium-binding mitochondrial carrier protein gene (SLC25A24) were significantly regulated, indicating the inflammatory and immune responses simulated by LPS. TNFSF10 is known as a TNF-related apoptosis-inducing ligand (TRAIL). TRAIL’s downregulation in all LPS- simulated groups suggested the original cell-preventive effect against cell death (28). IFI44L negatively modulates inflammation responses (29), and its downregulation indicated an anti-inflammatory process. In the positive control and BPE treatment, DLG5, and SLC25A24 were significantly upregulated compared to the negative group. DLG5 encodes a scaffolding protein that is involved in the maintenance of epithelial integrity (30). It was observed to be a susceptibility gene for inflammatory bowel disease, which is an archetypal inflammatory barrier disease (31). SLC25A24 is a kind of antiapoptotic protein gene, which is important in the response to oxidative stress (32,33). Therefore, BPE enhanced the anti-inflammatory ability of the cells. 3D SKIN MODELS A 3D skin model, Epikutis®, was chosen to evaluate the relief of allergic inflammation via BPE treatments. Multiple techniques (e.g., hematoxylin-eosin staining, immunofluorescence, and ELISA) were applied in the simulation experiments. As shown in Figure 3A, the damage induced by Poly I:C and LPS was significantly improved when Epikutis® was treated with BPE for 24 h. Meanwhile, BPE also alleviated the damage induced by SLS (Figure 3B). Figure 1. Effects of BPE on 2D cell models. (A) Assay of cell viability by HaCaT cells. (B) Assay of ROS level. (C) Assay of TNF-α content by RAW 264.7 cells. NC: negative control SGS: positive control, 0.1%, a commercial product (http://greaf-cc.ecer.com/sale-9601118-comthing-sgs.html) Vitamin E: positive control, 100 μg/mL DXMS: positive control, dexamethasone, 100 μg/mL BPE: 5 μg/mL #p 0.05, ##p 0.01, ###p 0.001, compared with the control group **p 0.01, ***p 0.001, compared with NC, n =6. Values are the mean ± SEM.

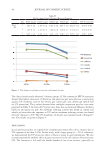
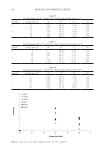
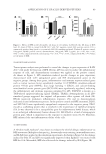
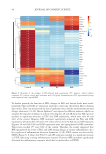
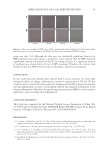
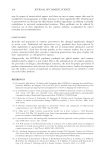
90 JOURNAL OF COSMETIC SCIENCE To further quantify the function of BPE, changes in FLG and loricrin levels were tested. Generally, FLG and LOR are important molecules connecting the keratin fiber in human skin cuticle. They can also prevent the loss of epidermis water and the invasion from external allergic substances (34–36). Herein, Epikutis® was exposed to different inducers, which can simulate the response of allergic or irritant stress. Figures 4A and 4B show that SLS exposure resulted in significant decreases in FLG and LOR expressions, which were only 44 and 46% of the control. However, BPE treatment significantly enhanced the FLG and LOR expressions, which reached 124 and 127% of the control. As to the Poly I:C and LPS exposures (Figures 4A and 4B), FLG and LOR expressions were also upregulated by BPE treatment. Their ratios reached 177 and 214% of the control. Therefore, the results suggested that BPE upregulated the levels of FLG and LOR during allergic or irritant inflammation. As a key regulator of inflammation factors in dermatitis (37,38), TSLP content was detected by ELISA (Figure 5). It shows that Poly I:C and LPS exposures resulted in a significant increase in TSLP, indicating a strong inflammatory response. However, BPE treatment significantly alleviated the inflammatory response, which had a similar effect as DXMS. Figure 2. Heatmap of the changes in LPS-induced gene expressions. NC: negative control without treatment PC: positive control with treatment with 100 μg/mL dexamethasone BPE: experimental groups with treatment with 5 μg/mL BPE.
Purchased for the exclusive use of nofirst nolast (unknown)
From: SCC Media Library & Resource Center (library.scconline.org)