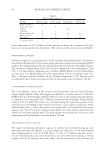
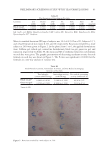
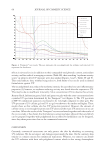
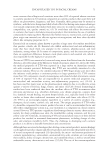
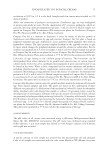
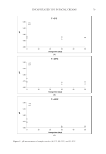
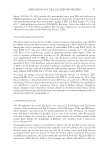
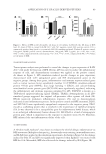
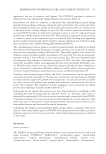
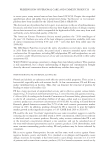
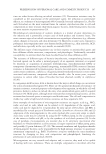
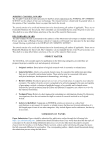
61 PRELIMINARY SCREENING STUDY WITH TEA FORMULATIONS 30 min later. Trolox equivalent antioxidant capacity was calculated based on a calibration curve obtained by the serial dilution of 1 mM Trolox. FREE RADICAL SCAVENGING ACTIVITY ANALYSIS The free radical scavenging activity of samples was measured with 1,1-diphenyl-2 picrylhydrazil using an assay described formerly (17). Briefly, 1,1-diphenyl-2 picrylhydrazil was dissolved in ethanol (4 mg/100 mL) and 100 μL of this solution was added to an equal volume of a sample. The mixture was shaken vigorously and the decrease in absorbance was measured at 515 nm after 30 min. Water was used as a control. The percent inhibition activity was calculated using the following equation: Inhibition activity (%)=[(A 0 – A 1 )/A 0 × 100], where A 0 and A 1 are the absorbances of the control and sample, respectively. CLINICAL STUDY SUBJECTS The group consisted of 21 caucasian subjects, 15 females and 6 males, 20–48 years old, with no known disease enrolled in the trial with written informed consent. The subjects were chosen under the control of a dermatologist based on the inclusion/exclusion criteria: The subjects were not using any topical or systemic medications, they had all healthy dermatologic appearance, they had no photosensitivity history, and none of them were pregnant or lactating. All of the trial procedures were performed in line with the ethical principles laid down for medical research (Helsinki Declaration of World Medical Association, 1964, and amendments). The study protocol was approved by the local ethics committee. After grading the skin types, the minimal erythema dose (MED) of each subject was determined on the upper back skin with the artificial narrow band UVB source (Gigatest UVB-311, Germany) and its emission spectrum is shown in Figure 1 (18). This handheld MED tester has five test fields, each with a diameter of 15 mM which emits different doses of UVB. The MED was determined as the lowest UVB dose that caused just perceptible erythema at 24 h. Figure 1. The emission spectrum of the lamp (UVB) (18).

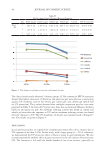
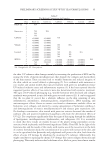
62 JOURNAL OF COSMETIC SCIENCE APPLICATION OF FORMULAS Six separate regions 2 × 2 cm in size at least 1 cm apart were marked on the dorsal trunk. Green tea gel, black tea gel, caffeine gel, vehicle gel, and an SPF 50 commercial sunscreen were applied to 5 areas at an amount of 2 mg/cm2 whereas one area was kept blank as control. The area of each topical application was randomly chosen on each subject. After 30 min of gel application, each of the six areas was irradiated with narrow-band UVB at a 2MED dose. Irradiation was performed by a dermatologist using the MED tester and another dermatologist evaluated the degree of reaction at 24, 48, and 72 h. In addition, volunteers were asked to apply tea gels to areas with erythema twice daily: the black tea gel to the control area and the green tea gel to the vehicle applied area. ASSESSMENT CRITERIA Skin erythema was assessed via clinical evaluation based on visual scoring of the reactions according to a standardized procedure in which severity of the reaction increases from 0 (no reaction) to 9 (severe reaction). The positive reactions were graded beginning from 1 as the mildest (very light, patchy pink hue) to 9 as the most severe (dark red color with vesicles or edema). TRANSPORE® TEST The efficacy of sunscreen filtering agent formulations in vitro was evaluated in a variety of ways. Transpore® (Pennsylvania, United States) test commonly used is one of the methods (19). Transpore® testing was performed after in vivo testing to support human studies and to give an idea about the absorption spectrum of different gels and the potential use of gels as sunscreens. In our previous studies, the gel formulation of Kenyan black and Indonesian green teas (Lipton, Unilever, Turkey), which had high UV absorbance and antioxidant capacity, was prepared at a concentration of 3%. New formulations were prepared by increasing the concentration of black and green tea used in the study to 5%. The concentration of the caffeine gel was also increased to 2%. The Transpore® tape was adhered to the quartz cuvette, 4 mg of gel was applied, and then dried for 15 min. The analysis was performed by taking the spectrum with a UV spectrophometer (Shimadzu UV Mini) aganist the reference with Transpore tape attached. The procedure was repeated 3 times for each sample. STATISTICAL ANALYSES A one-way analysis of variance was used to test the differences among groups. For multiple comparisons, Tukey’s test was performed. RESULTS The results of the HPLC analysis were given in Table II. In general, catechins quantities were comparable in both tea gels. But, unlike green tea, black tea gel contained TFs as the result of condensation of smaller catechins due to the fermentation process. Table III shows the results of total phenolic content, antioxidant activity, and free radical scavenging activity.
Purchased for the exclusive use of nofirst nolast (unknown)
From: SCC Media Library & Resource Center (library.scconline.org)