JOURNAL OF THE SOCIETY OF COSMETIC CHEMISTS The figures of the first row give the date of the month, soil Q2 having been prepared on day 1 and Q3 on day 2, and, in line 3, (a) indicates the group of the morning and (p) that of the afternoon. STATISTICAL ANALYSIS The above data are in a form very amenable to treatment by the statistical technique of the analysis of variance. This method of analysis wa.s, in fact, anticipated when the factorial design of the test was drawn up, for efficient -analysis cannot often be done unless the experiment is properly designed. An introduction to the use of statistical methods is given in Ref. 2, where the symbols here used are defined. Before carrying out an analysis of variance, the nature of the distribution of the results must first be examined. The present data, for instance, do not represent a continuous variable, but are in reality grouped data. It is conceivable that a certain amount of detergent in a test will wash precisely 5« or 5« plates, etc., but the actual result will be recorded as 5 or as 6. The value 6 thus represents all results between 5.50 and 6.49 or possibly 5.01 to 6.00, according to the operator. Whichever interpretation is given is here irrelevant, for recording differences will simply be included in soiling tech- nique and manner of washing in a composite value (capable of further analy- sis if desired) of variation between operators, but the fact that the data are grouped does introduce a bias into the calculation of variance, for which corrections (Sheppard's adjustments) should be applied. In such as the present example, where a transformation is also called for, the adjustments would become exceedingly complicated and are, therefore, omitted with the hope that no invalid conclusions will thereby arise. Such invalidity can often be detected by omitting the results of smallest magnitude (e.g., thb•e. for 1 g/i) and examining whether the new analysis of variance points to the same conclusions but where, as in the present instance, the set of data: is only one of a series of experiments, the most harm that can be caused is a slight waste of time in seeking explanation of facts that are not real. :: ii!i Much more serious errors can result if one performs the analysis variance without first ensuring that the data are homogenous.* appropriate test for homogenity is Bartlett's test described in most bookS:'?• on statistical •et•a•d • (e.g. Ref. 4a). An alternative devised by one of writers is to ca cu e he greatest variance of the N samples (or N operatorS?? * Ref. 3 is a paper on "The Evaluation of Test Procedures," and though it deals •vithii? rather precise analyses in contrast to a somewhat empirical test here being discussed, iS•} worthy of study. However, it should be pointed out that neglect of this principle ensuring that the data are homogenous has invalidated many of the conclusions dra?•i• from the analyses of variance there carried out.

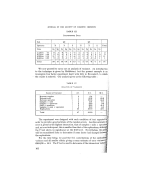
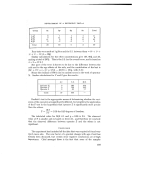
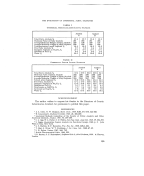
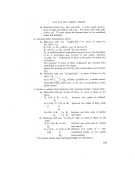
DEVELOPMENT OF A DETERGENT TEST--I or whatever variances are being tested) and compare it with the variance of the remainder, using the F test, and rejecting the null hypothesis at a signifi- cance level in one in 40N. This corresponds roughly with Bartlett's test at a 1 per cent significance level. A test of the above data for homogenity of the overall variance just fails to reach the rejection level on either the F test or Bartlett's test. The margin, however, is small and it is possible that, even if the overall variance is not really heterogeneous, one of the components of the variance may be so. The graph of overall standard error against mean results is roughly a straight line through the origin (being practically identical with that found by Pugh' and confirmed by many other experiments) which indicates that the error is proportional to the result. Transforming the data to a logarithmical form will, therefore, produce much more homogeneity of variance. ' Hence we now draw up a table of data in the same f6rm as Table I, but expressing the results as logarithms of the numbers of plates. To simplify the arithmetic, we next "code" the results by deducting a c6nstant and multiplying by 100. As we are not at present interested in comparisons between concentrations, we use different constants for the four samples, and take these near to the true means in order that the transformed figures will' be numerically small. The constants deducted are given in the seconc[ column of Table III. As an example, the results of Table I for 4 g/litre are given below, and the successive stages of the calculation are indicated. TABLE Date 2 3 6 7 8 9 Operator Y Z X Z Y X '1 Soil a p a p a p a p a p a p Q2 Q3 Q3 Q2 Q2 Q3 Q2 Q3 Q3 Q2 Q3 Q2 ,. Plates 16 14 14 14 18 16 13 15 12 12 14 16 Logarithm 1.20 1.15 1.15 1.15 1-26 1.20 1.11 1.18 1.08 1.08 1.15 1-20 Deduct 1.15 .05 .00 .00 .00 .11 .05 -.04 -03 -.07 -'07 '00 '05 X100 5 0 0 0 11 5 -4 3 07 -7 0 5 ,, The transformed results of the last row are then re-tabulated under main headings of soil and operator to give, with the other concentrations, the data of Table III. lol
Purchased for the exclusive use of nofirst nolast (unknown)
From: SCC Media Library & Resource Center (library.scconline.org)