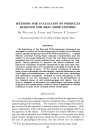
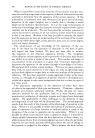
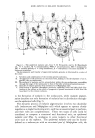
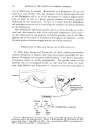
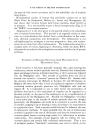
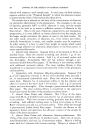
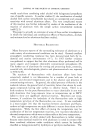
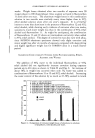
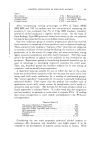
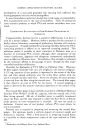
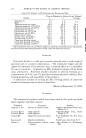
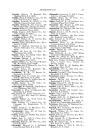
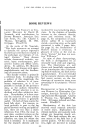
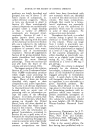
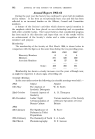
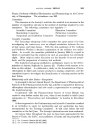
:288 JOURNAL OF THE SOCIETY OF COSMETIC CHEMISTS Figure 1.--A form of the Fair and Wells osmoscope presently in use for the evaluation of odors from the oral cavity. The subject closes his lips over the plastic mouthpiece at the end of the instrument to the left as shown. The evaluator places into his nostrils the nose-pieces seen at the right of the photo. Air exhaled by the subject through the osmo- scope is mixed with room air entering through the side arm in the body of the instrument. must be able to detect not only the odors from many oral cavities but also the comparative intensities. Any method used must be rapid because many of the odor producing agents react with other substances or decom- pose over short periods. One of the most successful tools for determining the intensity of an oral odor has been the Fair and Wells osmoscope (1). This device dilutes an odor from a source with a known amount of air to deliver continuously controlled ratios of odor-bearing gas to admixed air, as shown in Fig. 1. In its present form this instrument can be set in seven different ratios. The sensitivity of the device may be seen in Fig. 2. The equation for the graph shown is in the form: g---x •, [1] where x = the series dilution factor, g = the external signal strength, and n = the value of the osmoscope reading. Usually, holes are bored in the internal tube of the osmoscope so that x has a value of 2. g is given as the reciprocal of the parts per million of stimulant in the total gas emitted from the osmoscope if the amount of the

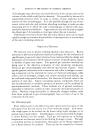
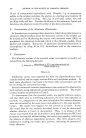
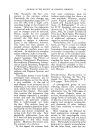
EVALUATION OF ORAL ODOR 289 stimulant is known or, in relative units if the amount of the stimulant or mixture of stimulants is unknown. For purposes of this paper, the form of the relationship of g to Fair and Wells osmoscope readings is sufficient for the discussion. It can be seen in Fig. 2 that very slight changes in the I I I I I I I I0 20 30 40 50 60 70 Excitation Stimulus (Odor) g Figure 2.--Response Character- istics of the Fair and Wells Osmo- scope showing the relationship between the osmoscope settings and the intensity of the external excitation stimulus. II- 0 i i I I I I I I I I I I I i I I I 2 4 6 8 I0 12 14 16 18 Excitation Stimulus g Figure &--Graphic display of the Weber-Fechner law showing the log- arithmic relationship between the excita- tion stimulus and the minimum percepti- ble difference in sensation. From Howell (2). lationship, first reported by Weber amount of g for low values of g will cause a large change in the osmoscope readings in the range of settings of 1 through 3. As g increases, its effect upon the change in osmoscope read- ings is less although the osmoscope is very sensitive to small amounts of stimulant. A problem arises in the case of odors of high intensity: A reading of 6 on the osmoscope may be just slightly above 6 or much greater. The length of the osmoscope could be extended to make more settings pos- sible. The device will now become unwieldy, but if it can be used for clin- ical testing it might be a good com- promise. Alternately the hole sizes could be changed to alter the value of x. Since the output from the Fair and Wells osmoscope is coupled into a nonlinear detector (the human nose), the sensitivity of the detector must, nevertheless, be analyzed be- fore it can be determined whether either of the approaches will be helpful. The human nose responds to an excitation stimulus in a rela- tionship in which the subjective sensation varies as the log of the applied stimulus intensity. This re- and later elaborated by Fechner, is known as the Weber-Fechner law of sensation (2). general relationship it may be broken into several forms. forms are of interest in the study of the osmoscope. These are: h o: Ag, g where h = intensity of the sensation (subjective) and Stated in a Two of' these [2]
Purchased for the exclusive use of nofirst nolast (unknown)
From: SCC Media Library & Resource Center (library.scconline.org)