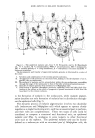
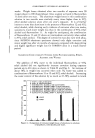
290 JOURNAL OF THE SOCIETY OF COSMETIC CHEMISTS g = external signal strength, and for a differential sensation, hx - h• = log g-•, [3] g• where subscripts denote a particular response to particular intensity of a given stimulant. Figure 3 shows graphic representation of the equations [2] and [3]. The greatest change in sensation results from the smallest change in the excitation when g is smallest. As g increases, the change in sensation becomes smaller. Both the detector and the osmoscope are most sensitive when the value of g is small--both become less sensitive as g increases. Therefore, the sensitivity is not increased much by increasing the number of settings on the osmoscope to record higher values of g. For this same reason, one will not gain much by increasing the value of n. What about an increase in the value of x ? By assuming a given value of g and increasing it, the difference between h for the initial value of g, and h for the new value of g will become less and less as the value of g becomes larger (equation 3). This means that an increase in x reduces the ability of the detector to sense changes in g, which now becomes larger at a greater rate. If one constructs an osmoscope in which x or n is increased, a further phenomenon will become apparent. Odors which were detectable only at settings of 4 and $ now all register as 6. That is, odors which were pre- viously reported as weaker odors seem to become stronger when it is known by the design of the instrument that the odor-producing mixture is even more dilute than before. The reason for this, which follows from an ex- tension of the Weber-Fechner law, involves the second derivative of the excitation signal strength. For purposes of this presentation, it will be stated simply without explanation. The rate of change of the change of intensity of g is proportional to the sensation h. By increasing the mixing hole size in the osmoscope, the abruptness of the presentation of the odor is increased, thereby allowing the nose to sense smaller amounts of the odor. Since we cannot alter the output characteristics of the osmoscope and detector complex, we must reduce g before we present it to the osmoscope. Simply stated the odor-containing gas must be diluted with air before intro- ducing it into the osmoscope. At a very low value of g, the changes of rate of presentation of g become small. Thus, if we make a series dilution of the oral odor gas with air before the mix enters the osmoscope, we are able to cancel the second derivative of g by recording the dilution for each individual tested at which his osmoscope reading becomes 1. In practice, this is not feasible because

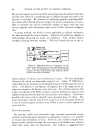
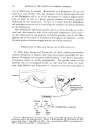
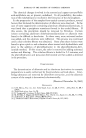
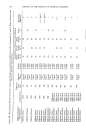
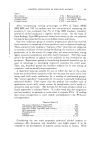
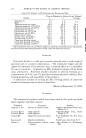
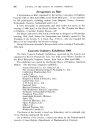
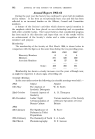
EVALUATION OF ORAL ODOR 291 of the number of dilution vessels needed, and becomes suspect because of the possibility of reaction or decomposition of the odor substance before it is assayed. Applying our knowledge of the sensitivity function and the rate limitations of our detector system, it becomes possible to design an odor monitoring system which can be used for the clinical evaluation of products designed to reduce the sensation of objectionable oral odors. This system has no upper limit since it can be designed to make the second deriv- ative of g become zero. Figure 4 shows the device in its simplest form. In operation, the test subject exhales through his mouth into the stem of the unit while the plunger is pulled back. The trained odor analyzer next places a stop at a o•Odor Collecting ChQmber Plunger •/"*--•SQmpling Cup MovQble Stop•--•- RemovQble Mouthpiece Figure 4.--Incremental odor dilution device for use with the method described in this paper. The movable stop is shown set in the X = 10 position. predetermined point on the plunger and pushes the plunger in at a constant rate (in a more complex embodiment of the device, this pushing at a con- stant rate can be accomplished mechanically), while he makes short shallow inhalations of the gas emitted from the stem into the sampling cup. As soon as the odor is detected, the device is aimed away from the tester until the gas has been expelled, except for that volume which is not released from the test cylinder because of the plunger stop. The tester then puts the device into a clean air environment and pulls out the plunger fully. The procedure is repeated until the odor is just undetectable. By taking the number of times the dilution procedure had to be repeated minus one and entering a table (Table I) under the listing for the particular setting TABLE I--PERcENT OF O•)OR CONTAINING G.•s LEFT AFTER THE nth DILUTION For Stop Settings (X) from 10 units 3 to 90 units 3 in a 100 unit 3 Odor Collecting Chamber and Dilution Cycles (n) from 0 to 5 n = x = 10 20 30 40 50 60 70 80 90 i 100 100 100 100 100 100 100 100 1009081 10 20 30 40 50 60 70 80 1 4 9 16 25 36 49 64 0.1 0.8 2.7 3.2 12.5 21.6 34.3 51.2 72.9 0.01 0.016 0.81 2.56 6.25 12.9 24.0 41.0 65.6 5 0.001 0.003 0.24 1.02 3.13 7.80 16.8 32.8 59.0 For dilution cycles greater than n = 5 the following form is used: (X/100) '• X 100 = per cent of odor containing gas remaining after the nth dilution cycle.
Purchased for the exclusive use of nofirst nolast (unknown)
From: SCC Media Library & Resource Center (library.scconline.org)