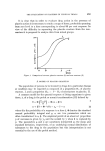
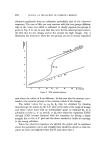
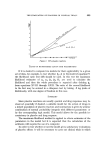
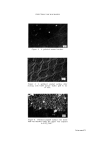
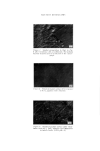
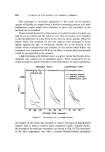
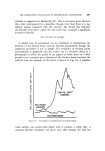
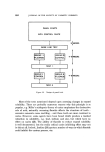
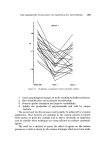
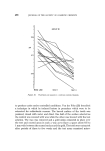
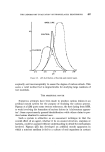
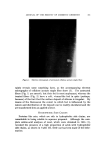
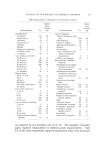
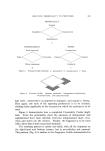
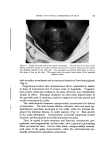
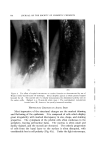
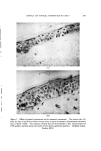
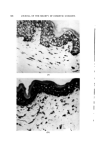
ELECTRON MICROGRAPHS Figure 4. A polished enamel surface. Figure 5. A polished enamel surface after etching •vith 0.2M lactate buffer (pH 4) for 15 min. ' Figure •. Polished enamel surface: the lower half was maaked while the upper was exposed to 0.2 % NaF. Facing page 478

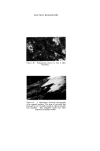
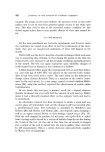
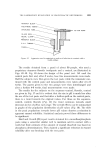
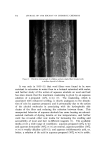
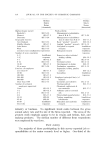
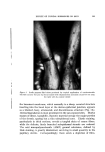
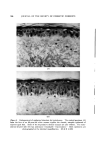
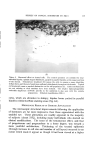
ELECTRON I•IICROGRAPHS Figure 7. Similar preparation to that in Fig. 6 after brushing with a toothbrush. The sodium fluoride treated area is on the left of the micro- graph. Figure 8. Polished enamel surface after exposure to 0.1% aqueous SnF2 solution. Figure •. Polished enamel surface after treat- ment with 0.1 •o SnF2 aolu.tion and immersion in lactate buffer (0.2M,
Purchased for the exclusive use of nofirst nolast (unknown)
From: SCC Media Library & Resource Center (library.scconline.org)