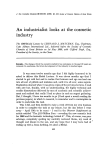
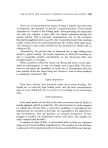
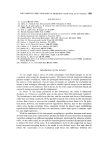
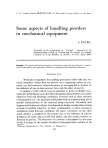
THE PARTICLE SIZE ANALYSIS OF PIGMENTS WITH THE QUANTIMET 677 li I ,,

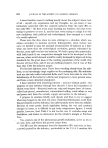
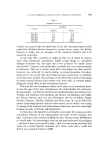
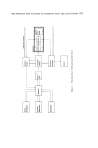
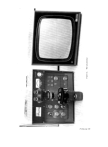
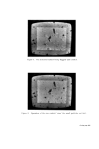
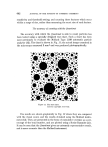
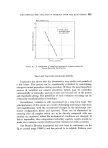
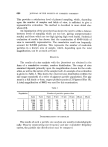
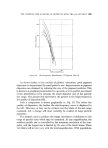
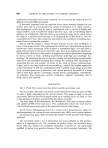
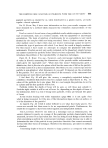
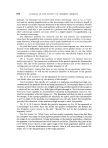
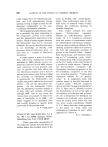
678 JOURNAL OF THE SOCIETY OF COSMETIC CHEMISTS As currently in use within our Plastics Division, the instrument consists of: an image forming device (in this case a microscope) a means of changing the optical image into electronically based information (a television camera) and a small specialised analogue computer which abstracts various para- meters from the system and presents the information in a suitable form (visually on a monitor screen, and quantitatively on a meter). The logistics of the operation are shown in Fig. 1. The detection and examination of features (9, 10) Let us consider a specimen of opaque particles which when examined on the Quantimet (Fig. 2) provides an image of the type shown (Fig. 8). The picture on the monitor screen is formed from a set of pulses pro- duced by the television camera as it scans across the image. They are of variable height depending upon the density of the feature being scanned, and of variable width, depending upon the length of the feature in the direction of scan. By means of a suitable threshold device, all pulses below a predetermined height are rejected. This enables dense features to be picked out against a light background, and noise to be separated and re- jected. During this 'detection' step, a signal of reverse polarity (e.g. Fig. is produced for all pulses which are greater than the 'threshold' level. Superimposition of these signals with those of the normal field of view (Fig. 8) enables the operator to select those features which are pertinent to the investigation (Fig. $). In this way, features may be selected as desired by varying the threshold setting. Having detected the features, the next step is to measure their character- istics. An examination of Fig. 5 shows that all detected features are crossed by one or more scan lines. The area of these features is thus related to the number and length of each intercepting scan line. By adding up the total length of these lines (now pulses) a value equivalent to the total particle area may be easily derived. The appropriate value may be read directly from the output meter, and related to the constant area of the super- imposed 'blank frame'. For example, the total area of the detected features as shown in Fig. 5, represents 5.7% of the blank frame (which is in turn of known size) (11). Taking the process one stage further, consider those pulses representing the intercepted features. At a dark to light boundary the pulse height will be falling rapidly. By using a circuit to detect this change, a series of point pulses equivalent to the boundary may be superimposed on the monitor
Purchased for the exclusive use of nofirst nolast (unknown)
From: SCC Media Library & Resource Center (library.scconline.org)