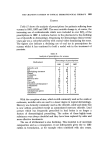
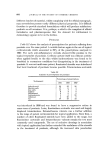
686 JOURNAL OF THE SOCIETY OF COSMETIC CHEMISTS This provides a satisfactory level of planned sampling, which, depending upon the number of samples and fields of view, is sufficient to give a representative evaluation. The method is described in more detail else- where (13). An examination of the procedure has shown the need to strike a balance between levels of sampling which are too low, (giving unrepresentative results) and those which are too high (giving high work loads). Statistical evaluation of results has shown that the examination of 40-50 fields of view is reasonably representative. The cumulative result can frequently account for 2-3 000 particles. This represents the number of resolvable particles in a known area of sample, which, depending upon the total magnification, can be as much as 6 cm 2. RESULTS The results of a size analysis with the Quantimet are obtained in the form of a cumulative oversize, number distribution. The range of sizes examined depends primarily upon the magnification chosen for the evalu- ation, as well as the nature of the sample itself. An example of an evaluation is given in Table I. This shows the observed size distribution (within the size range examined) of a series of pigment particle populations. The pig- ment is a full shade m-form, copper phthalocyanine (CI Pigment Blue 15). A total magnification of 380X was used for this examination. Table I Population Number of particles greater than 4pm 6pm 8gm 10gm i 14gm 18pm 28gm 38pm 1 2 266 943 472 121 46 30 7 1 2 1 137 423 166 82 27 13 3 0 3 395 140 56 28 : 7 3 0 0 4 381 169 77 48 ' 17 9 1 0 5 216 113 72 44 18 9 0 0 6 300 136 67 32 I 10 6 0 0 INTERPRETATION OF RESULTS The results of such a particle size analysis are usually evaluated graphi- cally. Thus by constructing size frequency and size cumulative frequency curves, the particle size distributions may be compared.

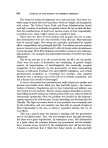
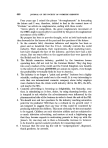
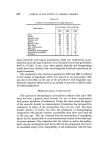
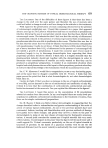
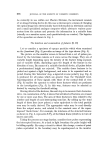
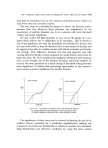
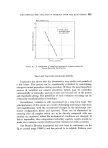
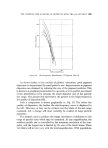
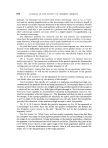
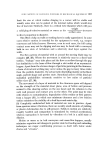
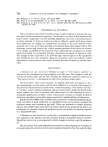
TItE PARTICLE SIZE ANALYSIS OF PIGMENTS WITH THE Q U•'INTIMET t387 lO0O lO0 lO 10 100 PARTICLE DIAMETER, Figure 18. Size-frequency distribution CI Pigment blue 15. As shown earlier, in the context of plastics coloration, good pigment dispersion is characterised by small particle size. Improvements in pigment dispersion are obtained by reducing the size of the pigment particles. This is shown in a graphical presentation by a general, or even partial, movement of the distribution curve towards the small diameter end of the particle size range. The greater this movement, the greater is the improvement in the quality of dispersion {13). Such a comparison is shown graphically in Fig. 18. The better the quality of dispersion, the further the size-frequency curve is displaced to the left. This may, or may not be evident over the whole of the size range examined, but a change will most certainly be evident at large particle diameters. The method used to produce the image introduces a limitation to the range of particle sizes which may be examined. At any magnification, the smallest particle size is controlled by the minimum resolution of the com- puter, and the largest size is limited by the size of the blank frame. These two limits will in turn vary with the total magnification. With populations
Purchased for the exclusive use of nofirst nolast (unknown)
From: SCC Media Library & Resource Center (library.scconline.org)