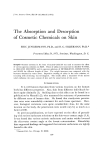
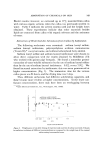
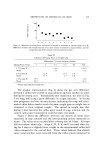
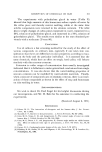
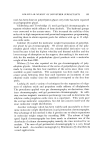
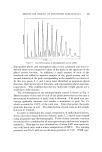
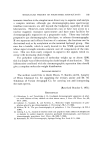
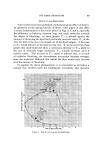
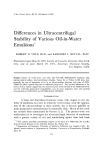
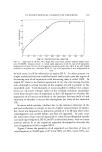
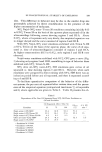
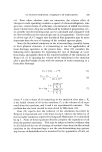
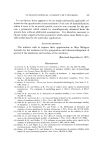
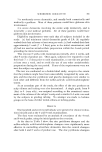
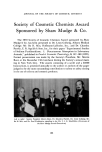
MOLECULAR WEIGHT OF POLYETHER SURFACTANTS 157 AP-OH + PPG CH•COC[ APA + PPGA I 1) 2N HCL 2) ETHER • H20 S ETHER APA.HCL PPGA 1) DIL.NAOH 2) ETHER AP^ PREPARATION OF QUATERNARY CH3CL APA a, ACETON• QUATERNARY APA Figure 2. Preparation of aminopolyether acetate (APA) with ether. Both ether extracts were dried over sodium sulfate and the ether was removed in vacuo. The acidic ether extract yielded 1.9 g of polypropylene glycol acetate. The basic ether extract yielded 13.5 g of aminopolyether acetate. The yield of combined product was quantitative and from the recovery of polypropylene glycol acetate it was determined that the starting mixture contained about 10% polypropylene glycol. Proof of separation of the two components can be confirmed from the infrared spectra of the products. These spectra were obtained on a Beck- man IR-10 spectrophotometer as smears on NaG1 plates. The glycol ace- tate has a band at 1740 cm -• due to ester carboxyl (G=O) and no band at 3400 cm -• where hydroxyl shows up in the starting material. In addi- tion, a qualitative test for nitrogen by the sodium fusion method was negative. On the other hand, the amino acetate has bands at 2805 cm -• due to the diethylamino group at 1740 cm% due to the ester carboxyl and none at 3400 cm q. The separated samples of the glycol acetate and amino acetate were then analyzed by gas chromatography. A Varian Model 1860 gas-liquid chromatograph, equipped with flame ionization detectors, was used. The column, 5 ft X 0.125 in. stainless steel, contained 3% SE-30 on Varaport (100/200 mesh). Helium carrier flow was 25 ml/min. The column was programmed from 120øC at 15ø/min for 5 min 6ø/min for 10 min and 4ø/min until 325øC and held. The relative areas of the observed peaks were measured by an electronic digital integrator. A complete analysis would obviously require identification of all the com- ponents in the mixture. However, sonhe conclusions can be drawn as to the composition of the two separated materials.

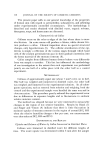
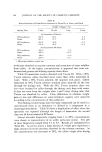
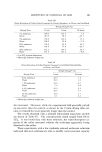
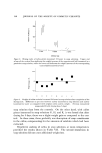
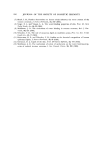
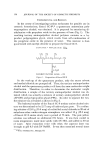
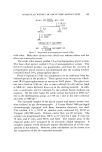
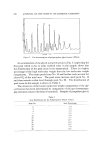
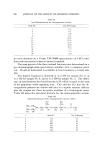
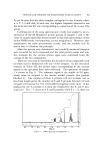
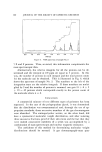
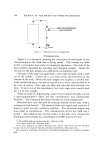
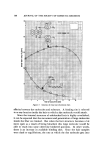
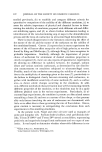
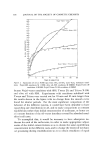
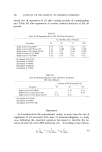
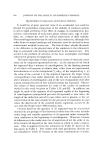
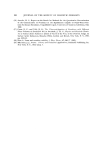
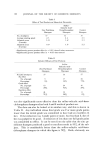
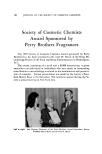
158 JOURNAL OF THE SOCIETY OF COSMETIC CHEMISTS 1 27 TIME ----) Figure 3. Gas chromatogram of polypropylene glycol acetate (PPGA) An examination of the glycol acetate fraction in Fig. 3, neglecting the first peak which is due to some residual ether in the sample, shows that the distribution of the peak areas is not symmetrical. There is a higher percentage of the high molecular weight than the low molecular weight components. The major peaks from No. 15 and further each account for about 8% of the total area. The peak areas increase until peak No. 15 and then remain at that level through peak No. 28. The distribution of peak areas in this sample is shown in Table I. The structure of the lowest molecular weight components of the gly- col fraction has been determined by comparison of the gas chromatogra- phy retention times with those of standards. Samples of propylene glycol, Table I Area Distribution for the Polypropylene Glycol Acetate Peak No. Area Percentage 2 3 4 7 12 15 18 21 24 27 28 14 12 19 33 58 77 8.7 8.2 8.3 7.8 8.1
Purchased for the exclusive use of nofirst nolast (unknown)
From: SCC Media Library & Resource Center (library.scconline.org)