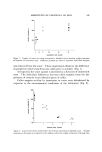
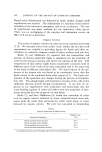
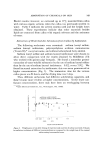
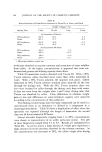
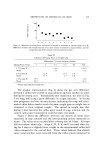
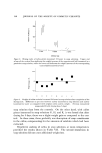
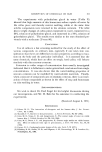
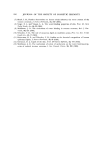
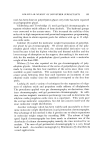
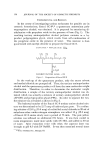
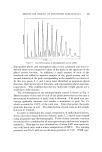
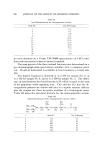
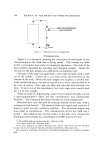
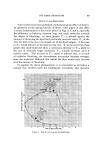
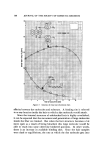
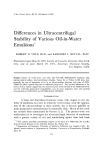
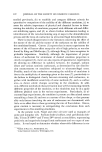
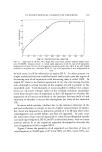
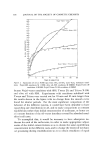
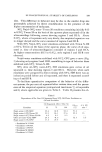
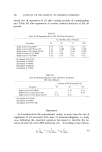
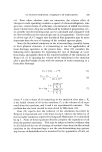
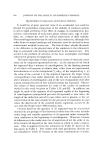
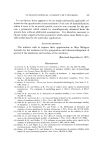
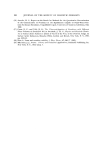
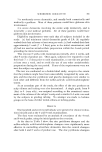
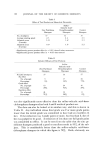
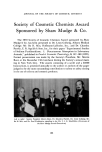
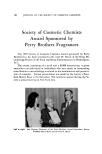
ULTRACENTRIFUGAL STABILITY OF EMULSIONS 175 8O •64- 16 I I I I I I I I I I 0 40 80 120 160 :00 :40 280 520 560 400 TIME OF CENTRIFUGATION, MINUTES Figure 1. Separation of oil from 50% Nujol-50% water-0.2% sodium do,decyl sulfate emul- sion (M 060669). Regions shown: I, initial rapid separation of oil II, rate of oil separation independent of time III, rate of oil separation decreasing with time, III-A if (as with Nujol) conforms to empirical eq 1, otherwise III-B IV, rate of oil separati.on is zero independent of time In such cases, it will be referred to as region III-A. In other systems, no simple analytical function could be found, and in such cases the region of decreasing rate of oil separation with increasing time is called III-B. In region IV, there is no further separation of oil, the rate having become zero, although a certain fraction of the original oil still is present in the emulsified state. Unfortunately, it is not possible to deduce the compo- sition (or oil-water volume ratio) of the residual emulsion unambigu- ously from the per cent oil separated, as this will depend on whether the separation of oil occurs exclusively at the interface between bulk oil and emulsion or whether it occurs also throughout the body of the emulsion (12). In more stable systems, whether due to the intrinsic character of the oils and surfactants or simply to use of a higher concentration of emulsi- fier, there was frequently an induction period of 5 to 20 rain after ultra- centrifugation was started before any free oil appeared. In such cases, the total curve of per cent oil separated rs. time of centrifugation usually was made up of regions I, III-B, and IV as described above, with no linear portion and no fit to the empirical equation developed to describe the rate of separation of oil in region III-A. Figure 2 shows the quantity of oil separated as a function of time of centrifugation at 39,460 rpm at 25øC for 50% oil-50% water-0.2% sur-

176 JOURNAL OF THE SOCIETY OF COSMETIC CHEMISTS 5C 48 46 44 40 38 36 34 c• t• 30 r 28 1.• 24 0 2o 16 14 I0 8 6 N U.lol - Water - SDS Ohve Od-Water-SDS 4 2 o /x Nujol-Water-Tween 20 Nujol-Water -Triton X-I00 15 30 45 60 75 90 105 TIME IN MINUTES Figure 2. Separation of oil at 39,460 rpm from 50% oil-50% water-0.2% surfactant emul- sions. Nuj•ol-SDS emulsions M 111968 olive oil-SDS emulsions M 060669 Nujol-Tween 20 emulsions A 091069 Nujol-Triton X-100 emulsions A 090969 factant Nujol-water emulsions with SDS, Tween 20, and Triton X-100, and olive oil with SDS. Experiments with emulsions stabilized with Tween and Triton were carried out for 10 min and 85 min longer than the results shown in the figure with no change from the smooth curve found for shorter periods. For the most significant comparison of the behavior of the different systems, it would have been desirable to have equal drop size distribution in all, and to make comparisons at constant equilibrium rather than initial concentration of surfactant, or better yet at constant fraction of the oil-water interface covered by adsorbed emul- sifier in all cases. To accomplish this, it would be necessary to have adsorption iso- therms for each of the surfactants, in order to make appropriate adjust- •nents of the initial concentrations so as to obtain the same equilibrium concentration in the different cases, and to change the extent of mechani- cal processing during emulsification so as to obtain emulsions of equal
Purchased for the exclusive use of nofirst nolast (unknown)
From: SCC Media Library & Resource Center (library.scconline.org)