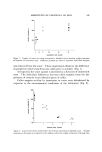
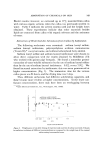
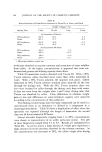
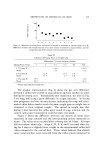
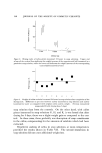
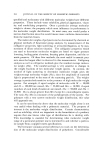
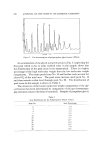
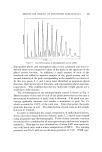
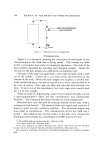
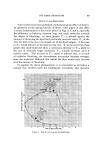
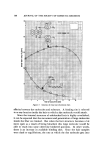
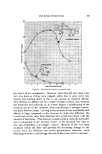
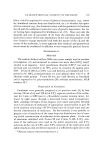
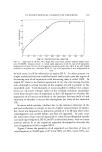
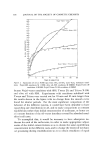
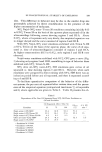
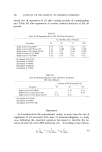
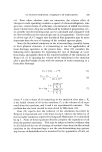
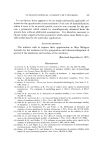
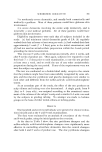
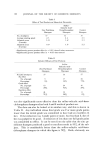
MOLECULAR WEIGHT OF POLYETHER SURFACTANTS 159 21 23 TIME Figsire 4. Gas chromatogram of aminopolyether acetate (APA) dipropylene glycol, and tripropylene glycol were acetylated and their re- tention times were compared to those of the peaks in the spectrum of the glycol acetate fraction. In addition, a small amount of each of the standards was added to separate samples of the glycol acetate and in- creased intensity of the peak corresponding to the standard was observed. In this way, peaks 2, $, and 4 have been identified as propylene glycol diacetate, dipropylene glycol diacetate, and tripropylene glycol diacetate, respectively. This confirms that the low molecular weight glycols are a small part of the mixture. The chromatogram of the aminopolyether acetate is shown in Fig. 4. Determination of the area of each of the peaks shows that in this case a symmetrical distribution of peak areas is obtained. The peak area per- centage gradually increases and reaches a maximum at peak No. 15, which accounts for 15.5% of the total area. From that point, the peaks gradually decrease in area. The distribution of peak areas in this sample is shown in Table II. In order to determine the actual composition of individual fractions, three consecutive major fractions (namely, peaks 5, 7, and 9) were isolated using preparative gas chromatography. Proof of their structure was then determined by a combination of mass spectroscopy and nuclear magnetic resonance. Mass spectra were obtained on a Varian GH7 mass spectrom- eter with batch inlet with a source temperature of 250øG. The ionizing potential was 70 eV with an accelerating potential of $ kV. NMR spec-

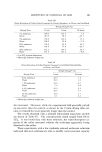
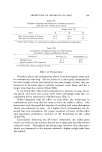
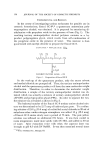
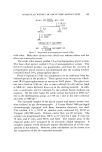
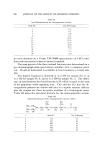
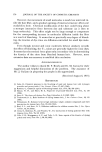
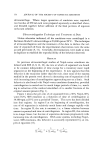
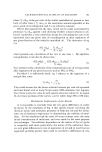
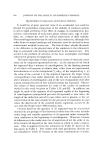
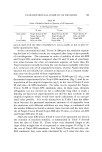
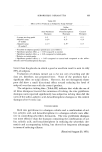
160 JOURNAL OF THE SOCIETY OF COSMETIC CHEMISTS Table II Area Distribution for the Aminopolyether Acetate Peak No. Area Percentage 1 5 7 9 11 13 15 17 19 21 23 24 09 07 28 64 10 3 12 5 13 5 12.8 10.5 7.7 5.3 2.8 tra were obtained on a Varian T60 NMR spectrometer on CdCla solu- tions with tetramethyl silane as internal standard. The mass spectra of the three isolated fractions were determined on a gas chromatograph-mass spectrometer interface with a computer print- out. If such an instrument is available, it is not necessary to isolate sam- ples. The highest fragment is obtained at rn/e 274 for sample No. 1 at m,/e 332 for sample No. 2 and at m/e 390 for sample No. 3. The differ- ence in mass between the three fractions is 58, which is equal to the mass of the propylene oxide repeating unit. This and the fact that the de- composition patterns are similar and vary in a regular manner indicate that the samples are three successive members of a homologous series. Table III shows the structural formula for the aminopolyether acetate. Table III Structural Formula of the Aminopolyether Acetate (APA) (D) (D) CHa CH• O CHa--CH•\ I I N--CH•--CH--O--(CH•--CH--O--)• C--CHa CHa--CH• (G) (F) (E) (F) (A) (C) (B) n Mol Wt No. of Protons 0 173 19 1 231 25 2 289 31 3 347 37 4 405 43 5 463 49
Purchased for the exclusive use of nofirst nolast (unknown)
From: SCC Media Library & Resource Center (library.scconline.org)