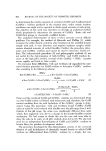
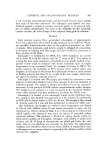
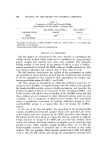
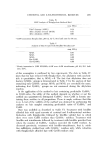
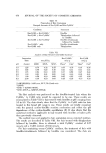
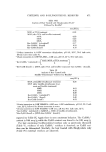
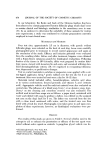
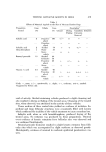
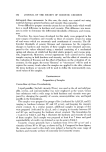
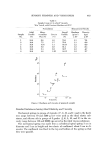
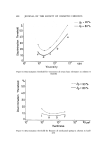
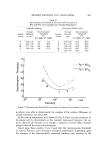
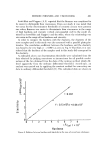
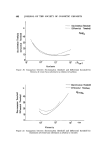
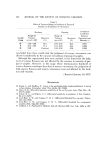
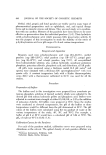
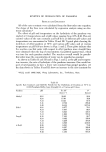
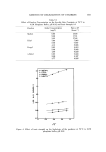
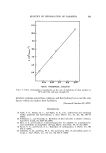
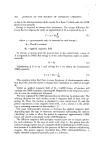
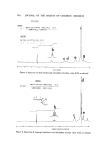
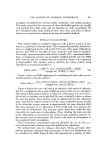
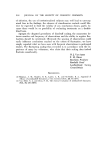
486 JOURNAL OF THE SOCIETY OF COSMETIC CHEMISTS c•100 •.= • 60 c• 40 •_ 20 o o ........ Y = 38.0 + 4.18 X- 0.104X • + 0.001 X • i x,•/ i i • • Relative Difference (zl-ta-b•'+-b 2 x lOO) Figure 3. Examples of approximation curves obtained by least squares method (sample c) a-b A-- a+b x100 2 The approximation curve was calculated from these points, using the least squares method, and is shown in Fig. 3. The value of the relative difference where 80 or 90% of the panels were able to give a correct judgment (p = 80, or p = 90) was obtained from this curve. In this paper, this value is referred to as the (relative) discrimination threshold of sensory firmness and viscous- ness, and it indicates that the diffcrence of hardness or viscosity in the two samples is judged correctly by 80 or 90% of the panel members. The discrimination thresholds of 80 and 90% correct judgments are shown in Table III. This is shown graphically in Figs. 4 and 5. Experiments on Standard Substances The discrimination thresholds for firmness of the standard elastic substance and viscousness of the standard viscous substance were studied. The discrimination thresholds of S0 and 90% correct judgments for firmness and viscousness were obtained for the mechanical spring and silicone oil in the same manner as previously described for the cream base substances. These results are shown in Table IV and Figs. 6 and 7.

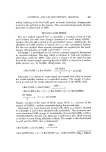
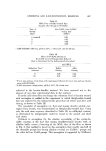
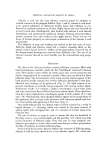
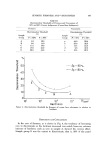
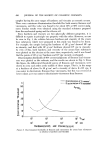
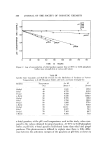
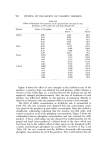
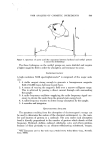
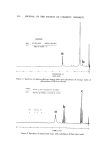
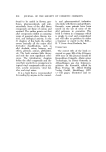
SENSORY FIRMNESS AND VISCOUSNESS Table III Discrimination Thresholds of Firmness and Viscousness of 80% and 90% Correct Judgements (Cream Base Substances) 487 Firmness Sample Group Discrimination Threshold (%) Sample P = 80% P = 90% Group Viscousness Discrimination Threshold (%) P • 80% P ---- 90% A 9.5 15.5 ,a 44.0 159.0 B 9.0 14.0 b 25.0 32.5 C 11.0 18.0 c 14.5 23.0 D 16.0 24.0 d 9.5 17.0 E 28.0 44.0 e 15.5 27.5 to 50 40 o "• 30 E o 20 10 " [3 ...... /lp = 90 %, •Ap= 80% i ! ! ..... 10 • 10 2 10 3 ]0 4 g / cm 2 Hardness Figure 4. Discrimination threshold for firmness of cream base substances in relation to hardness DISCUSSION AND CONCLUSIONS In the case of firmness, as is shown in Fig. 4, the tendency of becoming easy to discriminate as the hardness increased was noted however, extreme increase of hardness, such as seen in sample A, showed the reverse effect. Sample group B was the easiest to discriminate, that is, 80% of the panel
Purchased for the exclusive use of nofirst nolast (unknown)
From: SCC Media Library & Resource Center (library.scconline.org)