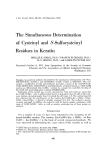
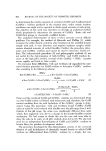
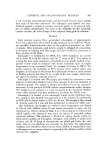
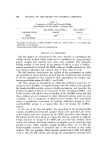
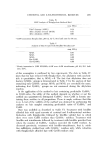
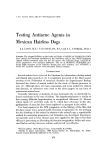
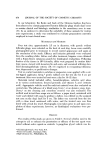
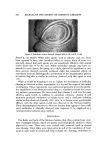
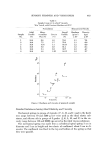
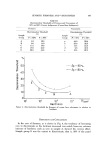
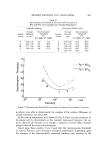
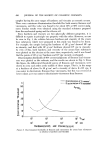
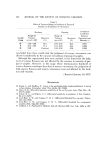
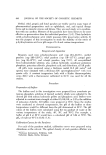
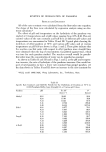
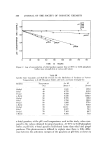
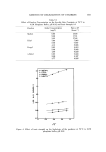
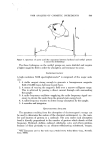
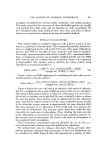
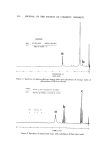
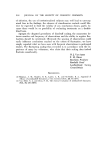
49g JOURNAL OF THE SOCIETY OF COSMETIC CItEMISTS ,,, ,,,40 lO Discrimination Threshold ........ Differential Threshold aP=80•o 101 102 103 10" (g/cm 2 ) Hardness Figure 10. Comparison between discrhnination threshold and differential threshold for firmness of cream base substances in relation to hardness • 40 ,-½5 30 :• •. 20 10 • Discrimination Threshold ..... Differential Threshold '4p=80• i 10 2 10 3 10 4 cps Viscosity Figure ii. Comparison between discrimination threshold and differential threshold for viscousness of cream base substances in relation to viscosity

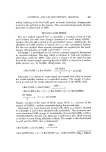
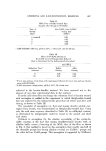
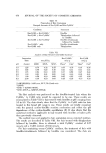
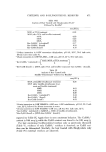
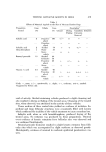
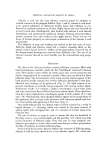
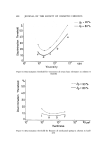
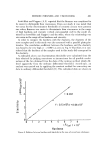
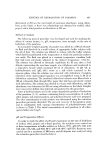
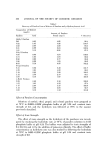
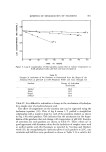
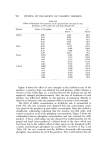
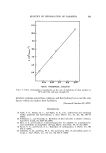
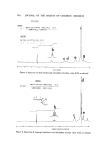
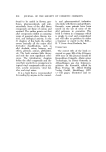
SENSORY FIRMNESS AND VISCOUSNESS 493 Figs. 10 and 11, and these curves show similar behavior with those of differ- ential threshold obtained previously, although slight differences were ob- served. Therefore, the discrimination thresholds obtained by these authors were considered to correspond well to the ordinary differential threshold,• In this study, the differential thresholds of sensory firmness and v•scous- hess were determined by preparing cream base substances having a constant viscosity and variable hardness and vice versa. Additional samples were pre- pared which varied both in hardness and viscosity simultaneously, and the effect of viscosity on the judgment of firmness and the effect of hardness on the judgment of viscousness were investigated. Samples with a hardness of about 2 x 10 2 g/cm'" and a viscosity of about 2 x 10 a cps were selected within the range where discrimination threshold of firmness was smaller than that of viscousness. Viscousness was evaluated with 3 sample groups (O, P, and Q) in the range where viscosity variance was kept almost constant, while that of the hardness variance was given in the 3 stages as shown in Fig. 12. In sample group Q, the viscosity was varied while the hardness was almost constant. In the case of P and O, both hardness and viscosity were made variable, where the rate of variance of hardness in group O is higher than that of group P, and the range of viscosity in each group was kept about the same. The results, shown in Table V, show that the correlation coefficient is high- est in the case of sample group O, when the hardness variance is the maxi- mum, and lowest in the case of samples Q without hardness variance. It was x 102 2 1 Maximum A*I, of Hardness 0 61.0 % P 31.4% g. Constant 2 • X 10 3 Viscosity (cps) Figure 12. Prepared samples to investigate the effect of hardness on evaluation of viscous-
Purchased for the exclusive use of nofirst nolast (unknown)
From: SCC Media Library & Resource Center (library.scconline.org)