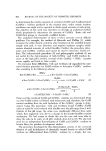
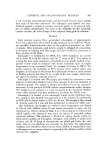
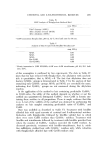
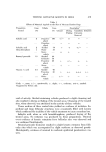
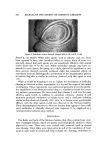
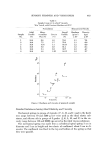
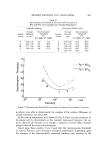
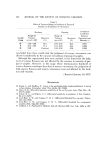
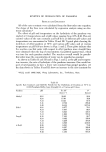
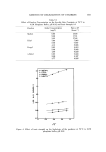
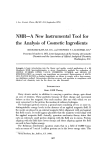
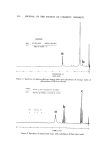
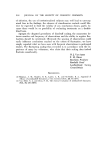
502 JOURNAL OF THE SOCIETY OF COSMETIC CHEMISTS 2.oe 1.2 0.4 I/Tx IO $ Figure 3. Arrhenius plot showing temperature dependence of the ethyl paraben hydrolysis at pH 9.16 in 0.1M phosphate buffer and ionic strength 0.3 Table V Specific Rate Constants and Half-life Periods for the Hydrolysis of Parabens at 25øC in 0.1M Phosphate Buffer, pH 9.16 and Ionic Strength 0.3, as Calcu',ated from Arrhenius Plots Paraben k x 10 • t 1/• (hours-•) (hours) Methyl 4.015 1726 Ethyl 1.514 4577 Propyl 1.122 6176 n-Butyl 1.096 6323 low the extrapolated value for the rate constant if the experimental activation energy falls within a range of 10-30 keal/mole ( 12, 13). Although data already obtained showed that the reaction of the parabens at constant hydrogen ion concentration was first order with respect to paraben, this first-order dependency was further verified by a study of the effect of initial paraben concentration on the hydrolysis rate. The results shown in Table VI indicate that for each paraben studied between concentrations of 4-7 rag/l, the rate constants were essentially independent of the initial con centration of paraben.

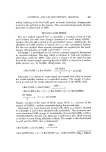
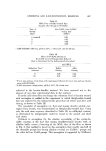
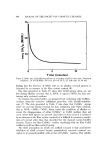
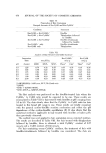
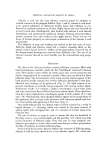
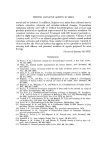
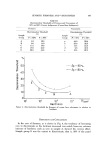
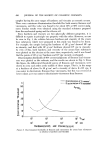
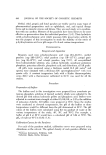
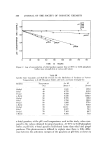
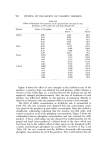
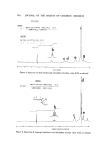
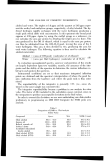
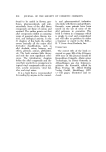
KINETICS OF DEGRADATION OF PARABENS 503 Table VI Effect of Paraben Concentration on the Specific Rate Constants at 70øC in 0.1M Phosphate Buffer, pH 8.24, and Ionic Strength 0.3 Paraben Initial Concentration Rate x 105 (mg/1.) (hours -•) Methyl 6.90 16.86 5.00 17.81 3.62 17.48 Ethyl 7.00 7.946 5.00 7.667 4.10 8.096 Propyl 5.95 6.063 5.00 5.982 4.00 6.229 n-Butyl 6.96 6.449 5.00 6.387 3.77 6.295 o, o.• 0.8 METHYL ETHYL PROPYL N-BUTY• ! ! ø'7o 0.6 o.9 ,h Figure 4. Effect of ionic strength on the hydrolysis of the parabens at 70øC in 0.1M phosphate buffer, pit 8.24
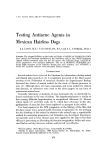
Purchased for the exclusive use of nofirst nolast (unknown)
From: SCC Media Library & Resource Center (library.scconline.org)