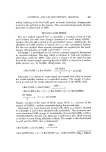
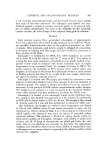
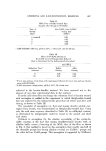
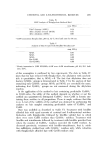
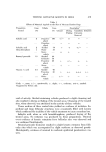
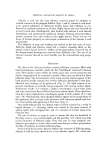
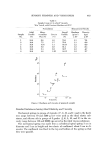
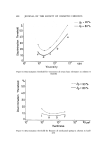
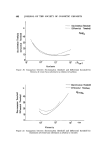
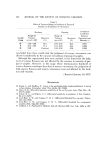
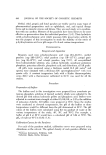
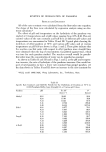
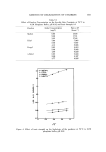
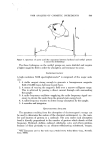
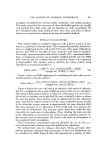
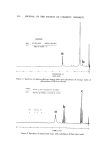
KINETICS OF DEGRADATION OF PARABENS 503 Table VI Effect of Paraben Concentration on the Specific Rate Constants at 70øC in 0.1M Phosphate Buffer, pH 8.24, and Ionic Strength 0.3 Paraben Initial Concentration Rate x 105 (mg/1.) (hours -•) Methyl 6.90 16.86 5.00 17.81 3.62 17.48 Ethyl 7.00 7.946 5.00 7.667 4.10 8.096 Propyl 5.95 6.063 5.00 5.982 4.00 6.229 n-Butyl 6.96 6.449 5.00 6.387 3.77 6.295 o, o.• 0.8 METHYL ETHYL PROPYL N-BUTY• ! ! ø'7o 0.6 o.9 ,h Figure 4. Effect of ionic strength on the hydrolysis of the parabens at 70øC in 0.1M phosphate buffer, pit 8.24

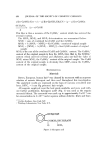
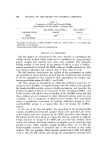
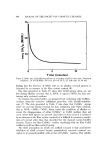
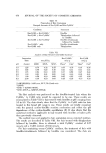
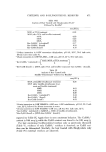
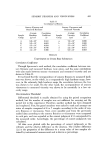
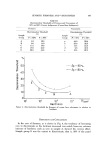
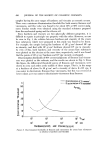
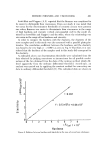
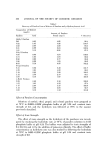
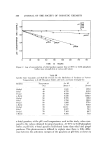
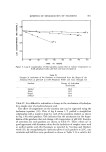
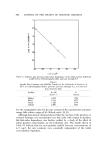
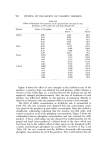
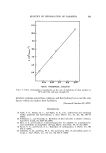
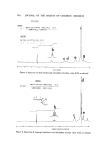
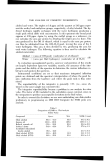
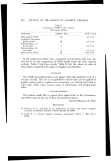
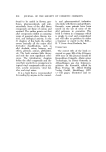
504 JOURNAL OF THE SOCIETY OF COSMETIC CHEMISTS Table VII Effect of Phosphate Concentration on the Specific Rate Constants for the Hydrolysis at 70øC, pH 8.24, and Ionic Strength 0.6 Paraben Moles of Phosphate k x 10 :• t v2 (hours-•) (hours) Methyl 0.02 11.46 60.3 0.04 12.84 53.9 0.08 16.42 42.2 0.10 19.05 36.4 0.20 26.87 25.8 Ethyl 0.02 5.175 133.0 0.08 6.920 100.0 0.10 7.862 88.1 0.20 10.45 66.3 Propy] 0.005 2.638 262.0 0.02 3.470 199.0 0.04 4.747 146.0 0.10 6.145 113.0 0.20 7.947 87.2 n-Butyl 0.005 2.486 278.0 0.02 3.836 181.0 0.04 4.759 146.0 0.08 5.634 123.0 0.10 6.418 108.0 0.20 8.008 86.5 Figure 4 shows the effect of ionic strength on the hydrolysis rate of the parabens. A positive slope was obtained for each paraben, which indicates a reaction of ions of like sign, i.e., a reaction between the hydroxyl ion and the negatively charged p-hydroxybenzoate. Also, the rate of hydrolysis of each paraben was influenced slightly by the presence of potassium chloride as noted by an increase in the rate constants with an increase in ionic strength. The effect of buffer concentration on hydrolytic rate is summarized in Table VII. The rate constants were obtained from log concentration versus' time plots for the parabens at each buffer concentration. Each plot yielded a straight-line relationship indicating that the reaction was first order with respect to paraben at all of the phosphate concentrations. Figure 5 shows the relationship between phosphate concentrations and rate constants for ethyl paraben. A linear relationship was also obtained for methyl paraben but the propyl and butyl esters produced a distinct break in the curve which may have been due to the catalytic effect of other species in the phosphate buffer (mainly monohydrogen phosphate ion at pH 8.24). As shown in Fig. 5 and Table VII, the rate constants and the half-lives decreased with increasing phosphate concentration for all of the parabens. This would indicate that the
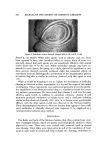
Purchased for the exclusive use of nofirst nolast (unknown)
From: SCC Media Library & Resource Center (library.scconline.org)