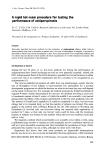
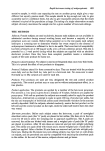
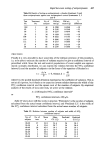
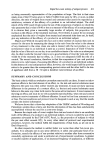
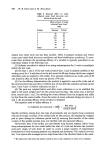
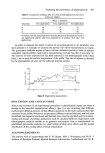
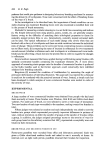
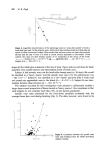
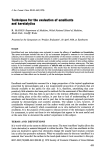
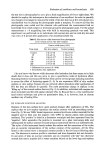
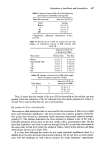
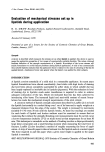
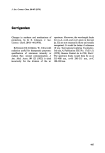
Rapid hot-room testing of antiperspirants 409 130 - 120 I10 •00 90 •, 80 '• 60 z 50 4o 30 zo I0 0 oo g8 88 8• • Log•o sweol weigh• •ases the sample standard deviation will necessarily be an unreliable estimate of the population standard deviation, regardless of whether the actual weights or their logarithms are used. Ove• a large number of tests we have found that the petGentage teduGtions in sweat weight calculated f•om geometric and arithmetic means tardy dJffe• by more than 2 or •, and deGisions based on the t•sults would be the same whJGhevet value was used. M•jor differences have been few, and have always proved to indicate a peculia• distri- bution of either test or control sweat weights. It •oDld •m pNdent to GoDsider the ptaGtiGal advantages as well as th• mathe- matical rigour of using arithmetic or geometric means. Wooding (?) has shown that the distribution of log weights deviates less from normality than the distribution of the weights themselves, and has argued that it is therefore more correct to use geometric means. With present levels of ptoduGt petfotmanGe there or disadvantage in doing so. If tD• tim• •v• orals, ho•v•, •D•D p•odD t• •ill •dD • the sweat weight in at least a few problem. Since the geometric mean of any array of numbers which includes zero is zero, •dhetenGe to the USe Of geometdG meads would then either lead to the manifestly absurd GODG]DSJOD t•t ]00• t•dDGtJOD •d b•D •G•v•d W•D OD][ OD• t•St •i]]• yielded zero weight, or require rejection of the ve• results which most strikingly demonstrated the success of the p•oduct. This m•y be in the far distant future, but neverthdess is food for thought. RATIOS The same data were used to study the variation between subjects and within subjects of the ratio of sweat weights from right and left sides. The object was to discover whether this ratio was sufficiently constant in the absence of antiperspirant treatment to serve as a parameter for the measurement of efficacy. Presentation of full individual results would involve tables containing several hundred figures and it is hoped that the following digest will sufficiently illustrate the main points.

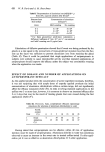
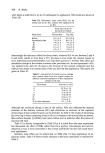
410 D. C. Cullum First the ratio of weights from right and left axillae was calculated for each individual pair of pads. To assess the between-subject variation, the mean ratio was calculated for B and C pads separately for each of the 10 days of the test, together with its standard deviation. To simplify assessment of constancy the coefficient of variation (CV), i.e. the standard deviation expressed as a percentage of the mean, was also calculated. The results are summarised in Table V. Table V. Between-subject variation in R: L ratio Day 1 Day 2 Day 3 Day 4 Day 5 B C B C B C B C B C Week Mean 1'11 1-04 1.20 1.00 1.12 1.06 1.21 1.19 1'07 1.15 1 S.D. 0.30 0'23 0'45 0'24 0'29 0'28 0-29 0-36 0'18 0-20 CV 27•o 22•o 385/o 24% 26• 26% 245/o 30•o 175/o 18% Week Mean 1.08 1.04 1-05 1.09 1-06 1.10 1.07 1.12 1.13 1.08 2 S.D. 0.35 0.20 0.27 0-27 0.27 0.20 0.24 0.26 0.21 0-26 CV 32• 19•o 26•o 25•o 25•o 19•o 22•o 23•o 18•o 24% The mean coefficient of variation was 25•o in Week 1 and 23•o in Week 2. The lowest individual value of the R: L ratio was 0.57 and the highest 2.39. To assess the within-subject variation the mean ratio, with its standard deviation and coefficient of variation, was calculated for the five B and five C pads separately for each week. For these figures the mean coefficient of variation was 15•o in Week 1 and 12}/o in Week 2. The variation within one subject on different occasions is therefore appreciably less than the variation between subjects on one occasion. In practice, however, one uses the mean value for the B and C pads together, and for simplicity Table VI shows only the R: L ratio for the combined B and C pad weights. Table VI. Within-subject variation in R: L ratio Week 1 Week 2 Subject No. Day 1 Day 2 Day 3 Day 4 Day 5 Day 1 Day 2 Day 3 Day 4 Day 5 53 1.08 1.12 1.12 1.00 1.21 1.13 1.13 1.28 1.21 1.21 38 0.72 0.99 1.29 1.89 1.03 0.77 0.77 0.90 1.04 0.84 339 0.95 0.90 0.83 0.99 1-04 0.94 0.81 0.85 0.89 0.93 42 1.18 0.91 1.22 1.32 1.32 0.97 1.21 0.72 0.87 1.09 350 -- 1.03 1.20 1.08 1.04 m 1.78 1-48 1.76 1.75 208 0-83 0.76 0-76 0.83 0.79 0.78 0-80 0.85 0.77 0.77 163 0.91 0-98 1.04 1.05 1.13 1-01 1.14 1.25 1.31 1.16 338 0.86 1.68 0.95 1.28 1.00 0.91 0.88 0-93 0.92 1.20 194 1.13 1.36 1.51 1.41 1.27 1.80 0.96 1.07 1.03 1.11 275 1.12 1.28 0.96 1.61 1.24 1.06 1.25 1-22 1-05 0.96 7 1.33 1.15 1-38 1.39 1-41 1.17 1.24 1.37 1.37 1.25 138 1.04 1.06 1-05 0.99 1.14 1.01 0.97 1.02 1.10 1.07 248 1.78 1.75 1.64 1.47 1.38 1.40 1.27 1.23 1.27 1.20 80 1-14 1.05 1-06 1.28 1-00 1.08 0.93 1.05 1.02 0.93 285 0.97 0.79 0.74 0.75 0.96 1-17 1-06 1.16 1.00 1.10 322 -- 0.80 0.75 0.91 0.81 0.78 0.97 0.95 1.02 1.15 It is not the purpose of this paper to enter into contention with other evaluation scientists two conclusions are, however, inescapable if these sixteen women are accepted
Purchased for the exclusive use of nofirst nolast (unknown)
From: SCC Media Library & Resource Center (library.scconline.org)