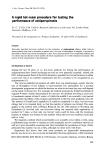
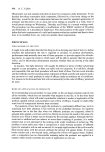
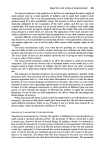
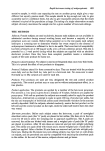
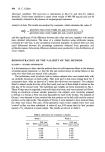
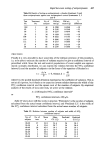
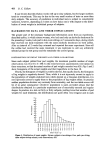
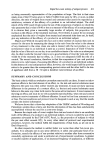
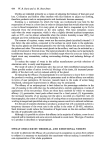
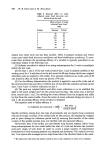
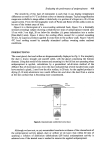
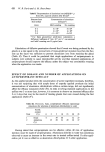
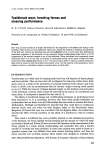
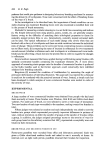
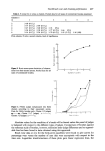
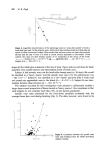
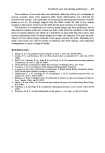
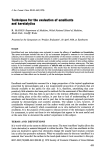
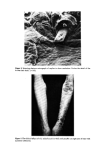
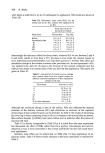
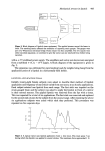
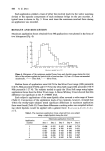
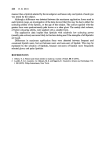
Toothbrush wear and cleaning performance 427 Table I. F ratios for rn versus n clusters. Pooled data for all types of commercial brushes examined Clusters n rn 1 2 3 4 5 6 3'60 (0'1%) 3-77 (0' 1%) 2' 89 (0' 1%) 3-47 (0'1%) 2'49 (0'1%) 1'74 (5%) 3'34(0-1•o) 2'38 (0'1%) 1'77 (0'5%) 1-66 (5%) 3'16 (0-1%) 2'24 (0'1%) 1'70 (0'5%) 1-55 (2'5%) 1'36 (NS) First column, F ratio second column, level of significance. Figure 2. Root mean square deviation of observa- tions from their cluster centres. Pooled data for all types of commercial brushes. 40- 30- 20- I I I -' I , I 2 3 4 5 6 Number of clusters Figure 3. Fifteen judges sub-grouped into three clusters according to their assessment scores. Data for Gibbs brushes only. Cluster 1 (5 judges) ß O Cluster 2 (7 judges) x x Cluster 3 (3 judges) O O. !oo - 75-- 50- 25[ 0 Vveor c9te'3ory Absolute values for the condition of a brush will be biased unless the panel of judges is balanced with respect to the different types of judges. Comparison of brushes against the reference scale of brushes, however, minimises inter-judge differences and no appreci- able bias has been found in data obtained using this approach. Brush wear data in vivo for the forty-seven panellists were found to give curves for percentage wear versus the number of uses that were asymptotic with respect to the time axis. Logarithm transformations of these plots gave linear regression lines, the

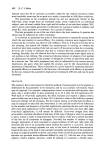
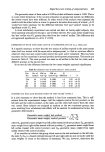
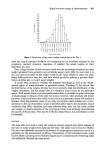
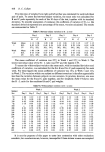
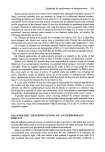
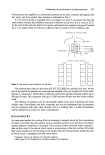
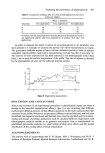
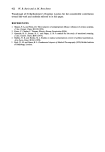
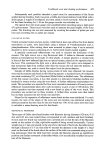
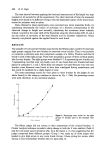
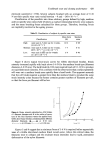
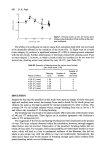
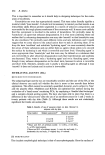
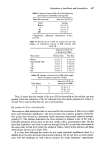
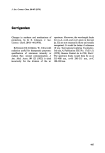
428 B. R. Pugh Number of uses 25 50 75 I00 125 ,- I x '----x--x- ' ø\ Figure 4. Logarithm transformation of the percentage wear (w) versus the number of times a brush had been used. All the subjects used a Gibbs short-head medium brush, but these data are typical of other commerical brushes. Other studies that we have carried out clearly demonstrate the fact that the rate of wear of a brush is almost entirely dependent on the subject. Those subjects who wear out their brushes quickly do so irrespective of the nature of the brush. X X Subject C (k= -8x 10-•t-x) • O (Subject B (/c= -44x 10-4t-•) 0 0 Subject A (k = - 383 x 10 -• t -x) . slopes (k) for which gave a measure of the rate of wear. Figure 4 shows such lines for three panellists who caused extreme and intermediate levels of brush wear. Subject A had severely worn out his brush after twenty uses (i.e. 10 days). He would be classified as a 'heavy wearer' and the specific wear rate k for his performance was -383 x 10 -4 t -x. Subject C was classified as a 'low wearer' and even after 8 weeks had not caused any appreciable wear to the brush (k= - 8 x 10 -4 t-x). Subject B was inter- mediate between these extremes (k=-44 x 10 -4 t-x). The subjects recruited for this investigation were selected to deliberately include a larger than normal proportion of those classed as 'heavy wearers'. Our experience is that such subjects do not comprise more than 10•o of any typical population. Specific wear rates calculated for the forty-seven panellists correlated with the average forces they used during brushing (Fig. 5). The data, however, were found to be /,- - 5o( ¸ _ - •ZO0 / I / / / / ß / / / / t / Force (N) i 2o Figure 5. Correlation between the specific wear rates and brushing forces for Gibbs short-head medium brushes.
Purchased for the exclusive use of nofirst nolast (unknown)
From: SCC Media Library & Resource Center (library.scconline.org)