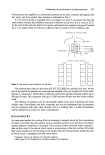
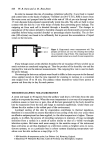
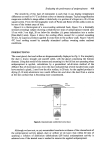
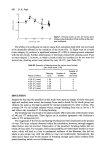
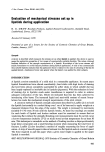
Toothbrush wear and cleaning performance 425 Subsequently each panellist attended a panel room for measurement of the forces applied during brushing. Each was given a Gibbs short-head medium brush fitted with a strain gauge, a supply of toothpaste, and then asked to brush normally. After the panel- list had been brushing for 5-10 sec the gauge recorder was switched on. The signals from the strain gauge were amplified before recording using a high speed UV galvanometer These traces were then used to measure the peak heights of the force pulses. The brushing rate was also measured by counting the number of pulses per unit time and converting this to pulses per minute. CLEANING in vitro Freshly extracted molars and pre-molars, which had at least one surface free from dental restorations or caries, were dyed black using a mixture of 4-methylcatechol and p- phenylenediamine. After cutting, these were mounted in plastic rings 4 cm in external diameter to form mosaics containing ten to twelve teeth closely packed together. A specially constructed reflectometer was used to measure the luminance of the mosaics. The light source was a ring fluorescent tube 12 inches in diameter mounted behind an hemispherical bowl made of white plastic. A mosaic placed in a circular hole in front of this bowl reflected light into an optical system, placed on the opposite side of the bowl. This condensed the light onto a photo-detector. The optics were designed so that extraneous light from surfaces other than the mosaic did not enter the detector. A digital voltmeter was used to record the output from the photo-detector. Samples of Gibbs brushes having various states of wear were obtained. Six mosaics were used to examine each brush in the following manner: a standard slurry of toothpaste was made containing 33•o w/w Pepsodent (Elida Gibbs) in distilled water. The reflectance of the first mosaic was taken, it was then placed in a laboratory brushing machine and brushed for twenty strokes using the worn brush. A further reflectance measurement was made. This procedure was repeated for four more successive increments of twenty strokes, reflectance measurements taken after each increment, to give a total of 100 strokes. The entire operation was then repeated with a new brush in place of the worn brush. This procedure was carried out on three mosaics. A further three mosaics were then tested but on these occasions the new brush was used first. Slopes for the regression of reflectance versus brush strokes were calculated. For each mosaic, the ratio of the slopes of the worn and new brushes was calculated using the arbitrary notation that the value for the new brush was 1.00. All six ratios were then used to calculate a mean cleaning score for that brush. MECHANICAL PROPERTIES Three types of Gibbs short-head brushes with filaments having diameters 0.20 mm, 0.25 mm and 0.33 mm were tested (these corresponded to soft, medium and hard brushes). In turn each new brush was mounted onto a pivoted arm so that the tips of the filaments rested on the surface of a flat, rigid table capable of being moved horizontally. Various weights (up to 2 kg) were placed on the arm above the head of the brush, the table moved through a distance of 2-3 cm then after 45 seconds the decrease in the height of a fixed mark on the head of the brush above the surface of the table was measured using a travel- ling microscope. Once the table had been moved, the filaments attained an equilibrium position and further movement of the table (within a few seconds) did not affect the curva- ture of the filaments.

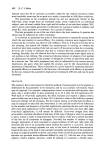
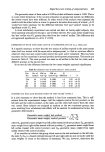
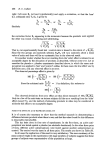
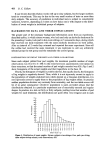
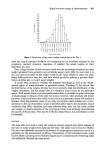
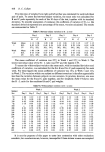
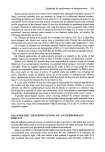
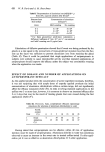
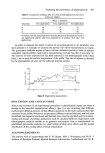
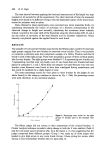
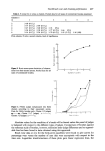
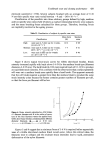
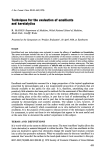
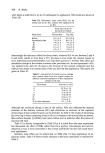
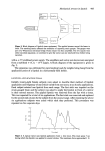
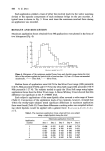
426 B. R. Pugh The time interval between applying the load and measurement of the height was kept constant at 45 seconds for all the experiments. For other intervals of time, the measured heights were found to be different owing to the time dependent nature of the stress-strain curves for polymers such as nylon. Data obtained in these experiments were converted into strain intensities firstly, by calculating theoretically the radius of curvature of a filament corresponding to the observed change in height and secondly, calculating the maximum strain intensity (which occurred in the outer shell of the filaments) using the relationship d/2R. R and d are the radius of curvature of the bent filament and its diameter respectively. Strain intensity was plotted against the applied force for each brush. RESULTS The samples of worn and new brushes examined by the fifteen judges could be formed into eight groups ranging from new brushes to extremely worn brushes. Thus it was possible to construct a reference scale that comprised a sample of a Gibbs, Wisdom and Oral B brush in each of the eight groups. These were mounted in groups of three on black plastic tiles for easy display. The eight groups were labelled 0-7, 0 representing new brushes and 7 representing ones that were very badly worn. It was found that new brushes had been placed in categories 0, 1 and 2. More than one category was used because even with new brushes, some filaments were found to have been misaligned during manufacture and this could be mistaken for a slight degree of wear. The mean percentage scores for wear given to these brushes by the judges do not relate linearly to the category numbers as shown by Fig. 1. Only the percentage scores were used, therefore, in any statistical analysis. ioo 50 25 0 I oe 3 4 5 6 7 Wear category Figure 1. Percentage wear scores for the eight groups of brushes used in the standard wear scale. The fifteen judges did not concur in their assessments of the original brushes. A Cluster Analysis technique revealed a sharp change in both the F ratio statistic (Table i) and the root-mean square deviation (Fig. 2) in the region n=3, thus suggesting that the judges comprised three different groups: Group 1 was made up of those judges who tended to give high scores to any worn brush, Group 3 those giving low scores, while Group 2 were intermediate between the two types (Fig. 3).
Purchased for the exclusive use of nofirst nolast (unknown)
From: SCC Media Library & Resource Center (library.scconline.org)