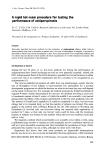
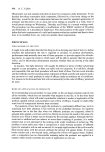
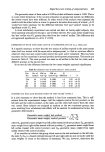
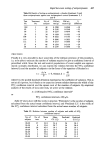
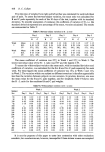
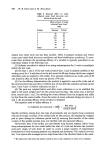
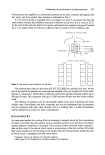
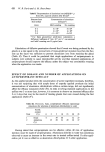
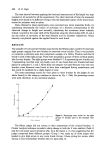
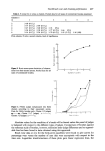
Rapid hot-room testing of antiperspirants 407 Table 1II. Results of testing an antiperspirant v. placebo (treatment 1) and three antiperspirants against one antiperspirant control (treatments 2, 3 and 4) Test Treatment No. of GM wt., GM wt., •o No. No. subjects test (õ) control (õ) difference 23E 1 48 0'2590 0'4240 --39 92 1 28 0-2156 0'3348 --35 96 1 22 0-2257 0'4079 -45 39 2 34 0'1624 0.1925 --16 100 2 42 0-2622 0.3185 - 18 110 3 57 0'2096 0.2823 -26 112 3 80 0.2317 0.3058 -24 37 4 46 0'1524 0.2138 --29 68 4 56 0-2279 0'3080 --26 PRECISION Finally it is very desirable to have some idea of the intrinsic precision of the procedure, i.e. to be able to estimate the number of subjects required to give a confidence interval of prescribed width. Since the test and control populations of sweat weights are approxi- mately normally distributed, we can express the relation between the 95• confidence interval A and the number of subjects n in the form of the equation of Student's t: t-- A•/n •4, whenceA - 4S s where S is the pooled standard deviation expressed as the coefficient of variation. This is not at all rigorous, but it leads us to expect an inverse relation between the width of the 95• confidence interval and the square root of the number of subjects. By empirical analysis of the results of sixty-nine tests, we arrive at the relation n---- (120/required 95•o confidence interval) a or 95•o confidence interval= 120/•/n. Table IV shows how well this works in practice. 'Predicted n' is the number of subjects calculated from the actual mean confidence interval, and 'Predicted C.I.' is the width of the 95•o confidence interval calculated from the actual mean number of subjects. Table IV. Relation between number of subjects and width of 95% confidence interval No. of No. of Mean Mean Predicted Predicted subjects tests n C.I. (•o) n C.I. (•) 20-29 37 24.8 24-6 24 24.1 30-39 8 33.0 20'7 34 20'9 40-49 10 42.8 19.1 39 18.3 50-59 9 52-7 15.7 58 16'5 60-69 1 68.0 12.6 91 14.6 70-79 2 75.0 12.9 87 13.9 80-89 2 84.0 11.7 105 13.1

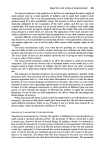
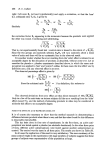
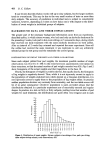
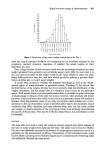
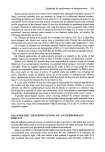
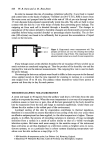
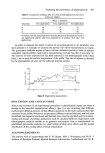
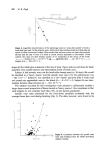
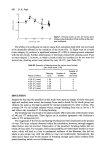
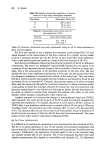
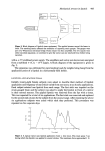
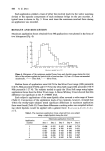
408 D. C. Cullum It can be seen that the relation works well up to sixty subjects, but for larger numbers tends to overestimate. This may be due to the very small number of tests on more than sixty subjects. The accuracy of prediction in individual tests is subject to considerable variation, however, depending as it does on how lucky one is with respect to the distri- bution of sweat weights in individual groups of subjects. BACKGROUND DATA AND THEIR IMPLICATIONS The greater part of the necessary background information came from an experiment, described earlier, in which sixteen women, who had used only an alcoholic deodorant for the preceding 2 weeks, took part in hot-room sittings on 5 consecutive days, during which they received one daily treatment with the same alcoholic deodorant on both axillae. After an interval of 2 weeks they returned and repeated the same experiment. Since all the axillae had received the same treatment it was legitimate to call any arbitrarily selected group the test group and the remainder the control group. DISTRIBUTION OF SWEAT WEIGHTS AND THEIR LOGARITHMS Since each subject yielded four pad weights, the maximum possible number of single observations was 16 x 10 x 4=640. In the event hot-room appointments were missed on three occasions, so that the actual number of pad weights recorded was 628. Figs 1 and 2 show histograms of the actual weights and their logarithms to the base 10. Clearly, the histogram of weights is positive skewed, but equally clearly, the histogram of log weights is negatively skewed. Thus, whilst it is not rigorously correct to apply to the population of weights statistical tests which depend on a Gaussian distribution, it is not rigorously correct to apply them to the population of log weights either. In practice neither population deviates very seriously from normality, and the inevitable errors will be of no great consequence whichever population is used, provided always that the distributions obtained in a particular experiment are of reasonably smooth and regular shapes. In practice, in a test on thirty or forty subjects, yielding twice that number of pad weights for each treatment, the distributions are quite often very irregular and in such IOO 90 80 '• 7o •o[- 0 -- = • ,• . . • . 7 ..... ' 6 6 6 6 6 6 6 6 6 -' Sweat weight (g) Fisure 1. DistributioD of' sweat wei8hts. SixteeD subjects x ted sittiDss x fou• pads per sittin8 tl•'CC subject-sittiDss missed total obse•,atiom, 68:2.
Purchased for the exclusive use of nofirst nolast (unknown)
From: SCC Media Library & Resource Center (library.scconline.org)