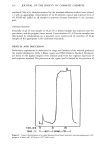
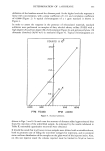
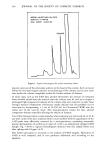
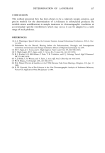
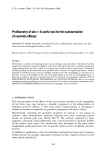
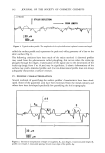
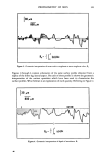
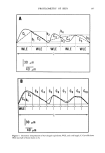
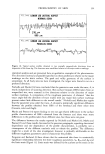
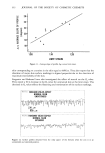
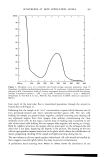
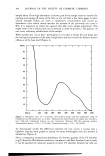
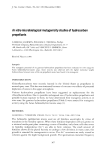
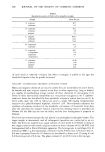
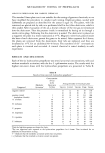
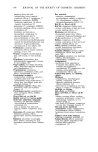
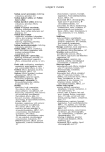
344 JOURNAL OF THE SOCIETY OF COSMETIC CHEMISTS 30 800 •3 1 i'! Z4 •5 n=5 Figure 5. Geometric interpretation of mean depth of roughness, Rz. depth of roughness, Rr, is defined as the maximum peak to valley depth within the scan length (/) and RrM is the mean peak to valley height. Maximum Peak height, R•,, is defined as the height of the tallest peak measured from the mean profile height. The quantity S is the actual profile curve length. The mean peak spacing, S,,, and the mean slope of the profile Aq, are not well defined. Both depth of roughness and maximum peak height are very sensitive to descrete 30,•m 800/.,m h 1 h2 h 3 h 4 h 5 Figure 6. The shaded area represents area under the trace, A: i.e., the area between the actual surface profile and the baseline which touches the maximum number of troughs or valleys. The arrows labeled h represent how peak height is measured.

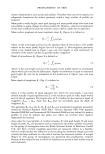
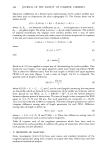
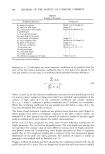
PROFILOMETRY OF SKIN 345 surface characteristics, such as hair and artifacts. Therefore they can not be expected to adequately characterize the surface geometry unless a large number of profiles are analyzed. Mean peak to valley height, mean peak spacing and mean profile slope have been used successfully to assess changes in surface profiles (8). However, a physical interpretation of the data is difficult because the criterion used to define a peak was not specified. Mean surface roughness or mean roughness value, Ra, (Figure 3) is defined as 1 f0l where l is the scan length and [y(x)[ is the absolute value of the locaton of the profile relative to the mean profile height (line 0-0 in Figure 3). This roughness parameter, which is the shaded area in Figure 3 per unit scan length, is used extensively by members of the metals industry to quantify surface roughness. Depth of smoothness, Rp, (Figure 4) is defined as 1 l = 7 f0 (2) where l is the scan length and y(x) is the location of the profile relative to a horizontal datum which just touches the tallest peak. Depth of smoothness is equal to maximum peak height, R•, and can be interpreted as the shaded area in Figure 4 per unit scan length. Mean depth of roughness, Rz, (Fig. 5) is defined as 1 Rz = - • gi, (3) •/ i=1 where n is the number of equal segments into which the scan length, l, has been divided (usually 5 equal segments) and Zi is the maximum peak to valley depth within each of the ith segments. The largest value of Zi is defined as the maximum depth of roughness, Z/max = Rma x. Note that Rma x does not necessarily equal the depth of roughness, Rr. The quantities Rr, RrM, R•, R•, R•, R, and Rma x are standardized roughness parameters (American National Standard ANSI B46.1, German Standard DIN 4768, .Japanese StandardJISBO601 and International ISO Standards R468) and are defined for positive profiles. It must be realized that peaks and valleys are reversed when negative impressions are scanned. Area under the trace (profile), A, number of peaks, 23, total peak height, H and mean height of peaks, Hm, are quantities used to characterize the surface profiles exclusively by the group of investigators from the Welsh National School of Medicine, Cardiff, U.K. (10). Each of these roughness parameters are measured relative to a baseline, which in earlier studies was defined as a line touching the lowermost trough and more recently has been redefined as a line which touches the maximum number of troughs (Figure 6). This group of investigators has pioneered skin profilometry, however because of the subjective way in which the baselines are arrived at their results must be used cautiously.
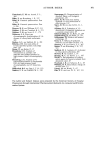
Purchased for the exclusive use of nofirst nolast (unknown)
From: SCC Media Library & Resource Center (library.scconline.org)