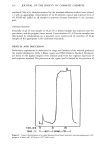
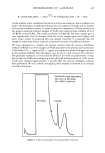
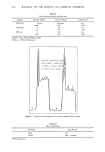
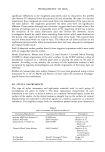
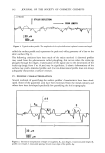
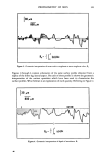
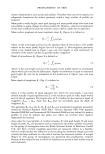
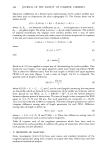
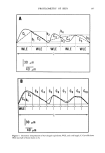
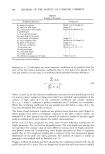
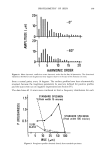
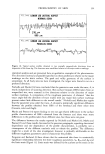
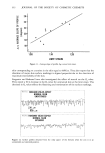
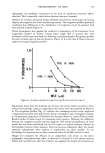
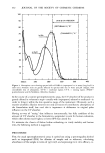
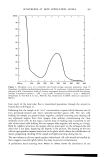
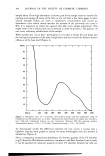
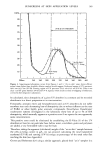
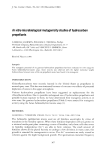
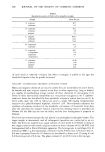
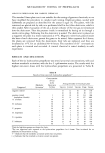
348 JOURNAL OF THE SOCIETY OF COSMETIC CHEMISTS Table II Roughness Parameters Roughness Parameter Investigators Rr, depth of roughness Makki et al. (6), Hoppe (12) R•, maximum peak height Hoppe (12) RrM, mean peak to valley height Ferguson and Barbenel (8) S, profile length ...... Sin, mean spacing of peaks ...... Aq, mean slope of the profile ...... Rz, mean depth of roughness Hoppe (12) R•, mean roughness value Makki et al. (6), Hoppe (12) Rp, depth of smoothness Hoppe (12) A,, harmonic coefficients Barbenel et al. (7) A, area under trace • Marks et al. (9, 10, 11, 15) H, total peak height • .... Hm, mean peak height ..... 23, number of peaks • .... P(i) differences among ratio of length Ishida et al. (13) •This is the current author's notation. Barbenel et al. (7) calculated the mean harmonic coefficient of six parallel scans for each of the first twenty harmonic coefficients (Eq. 4). The scans were spaced by 0.5 mm and I believe 10 mm long. A normalized autocorrelation function defined as 20 • A•iA2j = (lO) J •Zllj2•z12j21112 where A•i and A2j are the harmonic coefficients, was used for each possible pair of the six scans to detect outliars or those scans which are unreliable representations of the surface. A high value (0.7) of the correlation coefficient was usually obtained (0 _ r, • 1 where 1 indicates a perfect correlation and 0 indicates no correlation). When the correlation coefficients for any parallel scan fell below a value of 0.7, the scan was eliminated from further analysis. The mean of each harmonic coefficient was plotted versus harmonic order (Figure 8). These graphs were used to investigate variations in the skin's surface texture. As Barbenel et al. have pointed out, this method of analysis is similar to standard signal analysis methods and it may improve the surface characterization. Ishida et al. (13) have computed the mean value of each difference among ratio of length parameter, P(i), (eq 9) from 80 parallel scans. The scan length and spacing was not specified. The average value of each difference among ratio of length parameter was plotted versus the corresponding wave length equivalent to form a roughness profile (Fig. 9). The roughness profiles give a measure of the two dimensional spatial distribution of the peak and valley geometry. The method of analysis is similar in principle, to the method used by Barbenel et al. (7). Hoppe's method of analysis involved calculating the roughness parameters Rr, Rz, R•, and Ra for each of 12 scans. The scan length was 20 mm and each scan was run radially

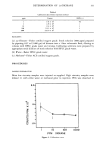
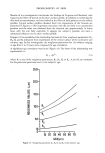
PROFILOMETRY OF SKIN 349 20 • 10- 0 _0 ø I I I _60 ø II ,ll....,. I I i 10 15 20 HARMONIC ORDER Figure 8. Mean harmonic coefficient versus harmonic order for the first 20 harmonics. The directional variation is shown for zero degrees and sixty degrees relative to the axis of the forearm (see text). from a central point, every 30 degrees. The surface profiles have been electronically reversed, because the roughness parameters he used are defined for positive profiles and the scans were run on negative impressions (see Section IV). The data from all 12 scans were combined to form a frequency distribution for each 1.5- 1.0- 0.5- STANDARD SPECIMEN •(Peak width 15 micron) • •(Peakwidth 100 micron) GLASS 1 5 10 25 50 100 WLE (•m) Figure 9. Roughness profiles obtained directly from standard specimens.
Purchased for the exclusive use of nofirst nolast (unknown)
From: SCC Media Library & Resource Center (library.scconline.org)