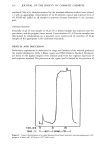
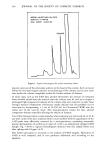
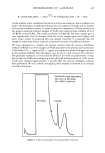
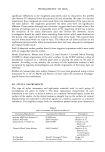
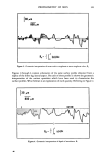
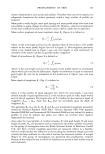
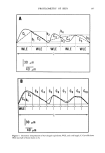
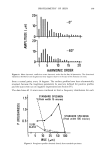
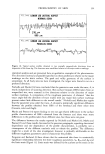
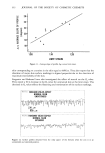
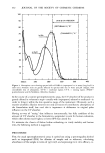
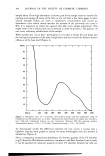
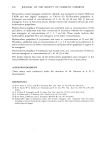
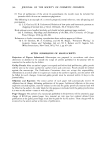
350 JOURNAL OF THE SOCIETY OF COSMETIC CHEMISTS roughness parameter. To account for "natural" variation in the skin's topography, this same procedure was repeated for impressions obtained from the same site on the same subject 48 h and 96 h after the first impression was made. A total of three impressions or 36 scans were analyzed per subject. The frequency distribution of each of the four parameters were compared to the corresponding frequency distributions obtained from the other impressions. If no significant differences existed between the distribu- tions, as determined by the Kolmogorov-Smirnov test or the Chi-square test, a combined distribution was computed for each roughness parameter. This same analysis was repeated for each subject in the sample population. Next, every subject's distributions were compared with every other subject's distributions. If no significant differences existed between the corresponding distributions, a combined distribution function was calculated for each roughness parameter. Once the sample's frequency distribution for each roughness parameter was obtained, they were stored to be used to assess changes in the same sample population after treatment. VI. RESULTS Makki et al. (6) have investigated the effects of several factors which influence the surface profiles obtained with the profilometers. They have demonstrated the need for multiple scans of the replica if meaningful results are to be uncovered. The variation of two roughness parameters, Ra and R• was assessed on casts of the forearm and abdomen. Fourteen subjects were used. Multiple scans, usually greater than five, were run in two mutually perpendicular directions. The coefficient of variation (CV) was calculated for each parameter, in each direction, for each cast. The mean CV for each direction and each site was also computed. The CV values were less than 20% in 78% of the cases and greater than 30% in •6% of the cases. The mean coefficient of variation irrespective of body site or direction of scanning was approximately 14% for Ra and 18% for R•, If these results can be extended to the other roughness parameters, then multiple scans of the replica are ngeded if changes in topography are to be assessed. These investigators also report finding a statistically significant difference in R• values obtained from casts of the forearm and abdomen. The R• values for the abdomen were consistently lower than those for the forearm. The roughness parameters Ra and Rr were also shown to be dependent upon the direction of scan relative to limb or body axis. The dependence was assessed by comparing results of multiple parallel scans run in six directions. The scans were run relative to the body axis for ca•ts of the abdomen and relative to the arm axis for casts of the forearm. In each case they found a significant difference between the maximum value of each roughness parameter obtained in one direction and the minimum value obtained in one of the other directions. Barbenel et al. (7) have reported similar site and directional dependent variations in the mean harmonic coefficients (Figure 8). We have demonstrated similar dependence of the surface profile characteristics on direction of scan. Figure 10 displays typical surface profiles obtained in two mutually perpendicular directions. These profiles were obtained from Daran © 220 (polyvinyli- dene chloride) impressions of the lower leg using a Surfometer (G.V. Planer Ltd.). Although the directional dependence is clear, these profiles have not undergone

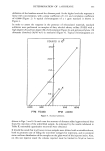
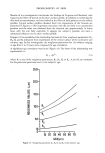
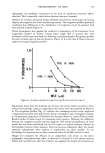
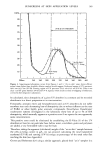
PROFILOMETRY OF SKIN 351 PCL14N1 LOWER LEG LATERAL ASPECT NORMAL SCAN 800 ,•m PCL14P1 LOWER LEG LATERAL ASPECT PARALLEL SCAN Figure 10. Typical surface profiles obtained in two mutually perpendicular directions from an impression of the lower leg. The directions were established relative to the major surface markings. statistical analysis and are presented here as qualitative examples of the phenomenon. The directions (normal and parallel) specified on these profiles are relative to the major markings on the skin's surface. The peak and valley geometry of the surface is anisotropic. At all body sites we have investigated, the ridges were found to run in a preferred direction. Nicholls and Marks (16) have concluded that the parameter area under the trace, A, is nearly independent of scanning direction. Skin surface biopsies (SSB's) taken from an unspecified site, were scanned in five directions relative to the direction of major surface markings. A comparison of the roughness parameter, A, showed: "that the exact angle that the direction of trace makes with any major skin surface markings present makes little difference to the overall results." Nicholls and Marks also report that the parameter area under the trace, A, showed a statistically significant difference between the profiles obtained from SSB's of the forehead and three other sites (forearm, wrist and thigh). Marks and Pearse (15) report finding no sex nor age related differences in the surface profile characteristics of SSB's obtained from the forearm and there were some differences in the profiles taken from different sites, but these were not great. The difference between the results reported by Nicholls and Marks (16) Marks and Pearse (15) and those results discussed in the previous paragraphs, regarding directional dependence and site dependence of the profile characteristics, is probably not a consequence of the different methods used to obtain the profiles. The difference might be a result of the sites investigated, however is probably attributable to the different roughness parameters used to characterize the profiles. Ferguson and Barbenel (8) have shown that for unstrained skin there is a statistically significant relationship between the three roughness parameters, S,•, Rr• and Aq and the limit strain (Figure I1). Limit strain was defined by the authors as the strain in the
Purchased for the exclusive use of nofirst nolast (unknown)
From: SCC Media Library & Resource Center (library.scconline.org)