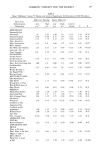
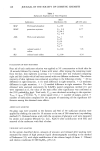
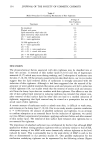
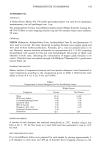
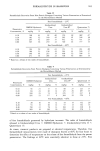
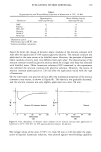
138 JOURNAL OF THE SOCIETY OF COSMETIC CHEMISTS Table I--(Continued) Self-Image: Positive/Negative 1.50 0.88 1.88 0.88 0.25 1.62 N.S. OUTLOOK ON LIFE Positive/Negative 2.13 0.75 0.38 0.63 0.13 4.14 0.01 ATTITUDE To Make-over Sessions 1.25 2.25 2.88 3.13 0.38 5.73 0.01 To Make-up 1.38 1.58 1.63 1.75 0.25 1.29 N.S. MOTIVATION To Care for General Appearance 1.38 1.0 0.88 0.75 0.50 0.69 N.S. Long-Term Overall Summated Score Across 22 Dimensions 9.88 8.50 12.75 5.86 -4.00 2.76 0.05 * "Difference" score refers to the result of subtracting the score for the "before" rating from the score for the "after" rating for each subject the mean across subjects is shown for each scale. a p.a. = Physical Attractiveness. b N.S. = Not Significant. Long-term assessment The subjects in all groups completed a set of 22 7-point scales (derived in a manner similar to that of the short-term scales) one week before and again one month after the make-over session. These scales assessed self-perceived mental health, physical health, aging, personality and self esteem, and appearance self-image. Also, we provided a booklet for recording daily cosmetic usage, one week prior to the make-over, one week after, and again after one month. Finally, the long-term follow-up included a short interview questionnaire administered by the senior author. This involved questions on continued cosmetic care and general comments about the entire experience. TREATMENT CHECK As a check up on the validity of the make-over manipulations, the subjects were asked at the end of the make-over to indicate how much they felt they had learned--"nothing at all," "just a little," "quite a lot," or "very much indeed." Of the 16 in the passive make-over group, one reported learning "just a little," 11 reported learning "quite a lot," and 5 "very much indeed." A X 2 test showed that people in the "make-over training" group learned significantly more than the people in the "passive make-over" group, X 2 = 1161.55, 1 d.f., p 0.001. This was the anticipated result. EVALUATION OF DIFFERENCE SCORES The points on the seven-point rating scales were converted into scores from 1 to 7 the more positive the rating (i.e., the nearer to the positive pole of the scale), the higher the score. For both the short- and long-term assessment, "difference" scores were calculated for each subject's rating on each dimension by subtracting the "before" from the "after" score. For the two age questions, the "after" age was subtracted from the

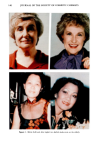
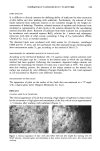
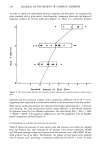
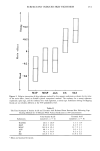
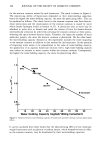
COSMETIC THERAPY FOR THE ELDERLY 139 "before" to give a value "number of years younger." This could be minus if the person felt older afterwards. These scores formed the raw data for the statistical analyses. RESULTS Figure 1 illustrates the remarkable transformations possible with skilled make-overs. 2 Short-term assessment A multivariate analysis of variance was conducted, combining the difference score data from the twenty-five 7-point scales, followed by 25 univariate analyses of variance. In addition, an analysis of variance was conducted for each of the two age measures. These analyses were followed by a priori orthogonal comparison tests on each of the scales that revealed a significant difference on the univariate analysis, to determine which treat- ment(s) differed from other treatment(s). The statistical design for both types of analysis of variance was a one-way analysis with 5 levels of the independent variable (5 treatments/groups), each group having 8 obser- vations. Additionally, in the multivariate analysis there were 25 dependent measures. The multivariate analysis of variance revealed a Wilks h. value of 0.00377 the ap- proximate F value was 1.424 with 100,46.15 d.f. This F value was significant, p 0.01. This signified that when considering all the scales together, there was an overall significant difference somewhere between the groups. The univariate analyses of variance were then conducted to determine the effects of the treatments on individual scales. The results for these are summarized in Table I. Table I shows that there was an overall significant difference somewhere between the five groups for 11 of the short-term measures. These were self-perceived changes in appearance (physical attractiveness and looking well/healthy) attitude to socializing (feeling like going out, social confidence, feeling glad to see people) feelings (opti- mism, confidence in appearance) some aspects of self-image of appearance (wanting to be seen by people, feeling happy to look at self in the mirror) outlook on life and attitude to make-over sessions. It should be noted, however, that there was also a substantial number of dimensions not affected by make-over. Means scores for all scales are shown in Table I. A priori orthogonal comparisons of means tests (13) were then conducted for each of the dimensions where there was an overall significant effect, to find out which groups differed from each other. In regard to the first hypothesis that make-overs would have beneficial effects on psycho- logical well being, short-term effects were as follows: Appearance.' The make-over groups rated themselves significantly more attractive (F = 21.85 1,35 d.f., p 0.001) and more well/healthy looking (F = 10 1,35 d.f., p 0.01) than the controls. 2 The make-overs illustrated here were conducted by Glenn Roberts of Elizabeth Arden, Inc., who con- ducted the make-overs for our studies with the elderly.
Purchased for the exclusive use of nofirst nolast (unknown)
From: SCC Media Library & Resource Center (library.scconline.org)