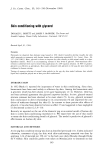
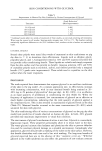
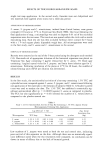
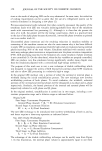
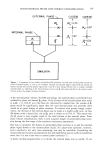
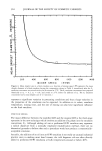
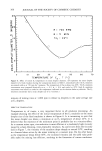
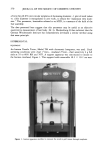
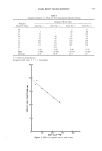
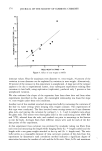
364 JOURNAL OF THE SOCIETY OF COSMETIC CHEMISTS 0 I I i, I I 200 400 600 800 I000 1200 1400 MIXER SPEED (RPM} Figure 4. Mean droplet size in a final emulsion as a function of mixing speed. (• represents the mean droplet diameter of a final emulsion having the composition shown in Table I, immediately after the E 2 emulsion concentrate was mixed with oq for 8 minutes at 27øC. The E2 emulsion concentrates were prepared identically at % = 0.2, oq = 0.8, and cooled to 27øC before the addition of oq. The E 2 emulsion concentrate had a mean droplet size of 2.5 microns.) represent a significant variation in processing conditions and thus a large variation in the properties of the emulsions can be expected. In addition to o• values, emulsion temperature, mixing time, and the rate of mixing can also have significant influence on the final emulsion. EFFECTS OF MIXING The major difference between the modified LEE and the original LEE is the third-stage operation in the new technique which involves an addition of oq phase into the emulsion concentrate, E 2. Although adding oil into a preformed O/W emulsion may represent a radical departure from a normally employed emulsification method, there are no theoretical grounds to believe that such a procedure would not produce a commercially- acceptable emulsion. Actually, the addition of an oil into an O/W emulsion is not really an unusual industrial practice since in making most hand creams, the cold fragrance oils are often directly added to preformed O/W emulsions at bulk temperatures around or below 40øC.

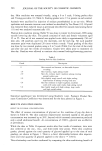
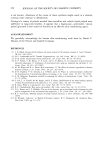
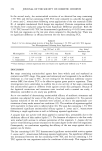
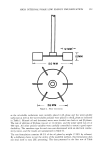
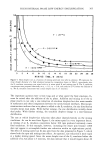
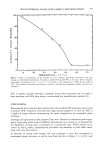
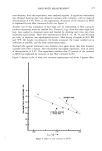
HIGH INTERNAL PHASE LOW ENERGY EMULSIFICATION 365 5O z o o r-• Z 4O 3O 2O I0 T = 27"C = 300 RPM ••=••••m•m•O 0 RPM R = moo0 I•PM• 0 o 2 4 6 8 I 0 12 14 16 18 20 22 24 :::)6 2_8 MIXING TIME, ,9 (MIN) Figure 5. Mean droplet size as a function of mixing speed and time after o• addition. (• represents the mean droplet diameter of a final emulsion having the composition shown in Table I, immediately after the E 2 emulsion concentrate was mixed with oq at mixer speed R and mixing time 0. The E2 emulsion concentrates were prepared identically at o• e -- 0.2, oq = 0.8, and cooled to 27øC before the addition of oq. The E• emulsion concentrate had a mean droplet size of 2.5 microns.) The important question here is how long and at what speed the final emulsion, El, must be mixed after the addition of the oti phase. Addition and mixing in of the oti phase results in not only a size reduction of emulsion droplets but also mass-transfer of surfactants and other components between the newly formed interfaces. Microscopic examinations indicate that as oti phase is added to the E2 emulsion, the size distribution initially shows dual peaks. With further mixing, the size distribution initially shows dual peaks. With further mixing, the emulsion droplets change to a near-Gaussian distribution. The rate at which droplet-size reduction takes place depends heavily on the mixing conditions. As can be seen from Figure 4, the mixer speed is a very important factor, as mixing of an E2 emulsion concentrate below 300 rpm produced extremely coarse final emulsions. In this example, however, increasing the mixer rpm beyond 1,000 does not appear to accomplish further size reduction within an eight-minute period. The effect of mixing speed can be also seen from the data presented in Figure 5, which shows both the rpm and mixing-time effects. As expected, size reduction is more rapid at a higher mixing speed. Since the mean droplet size of the E• emulsion before the addition of o• i was about 2.5 microns, the data indicate that it would require about 20
Purchased for the exclusive use of nofirst nolast (unknown)
From: SCC Media Library & Resource Center (library.scconline.org)