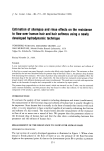
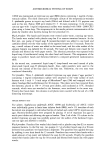
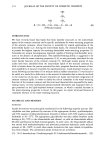
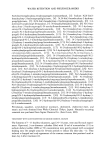
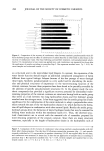
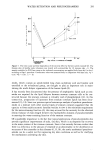
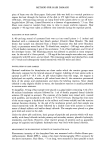
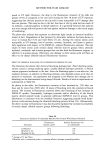
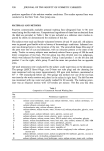
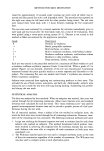
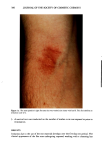
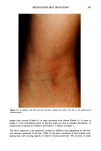
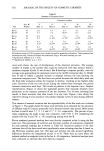
METHOD FOR SKIN IRRITATION 301 Figure lb. A panelist's left flex area that has been washed nine times with bar A. No indication of irritation exists. ranges from normal (Grade 0), to deep erythema with edema (Grade 3). A score of Grade 2 is the termination point in the flex wash test due to panelist discomfort. A characteristic response for Grade 0 and Grade 2 is shown in Figure 1. The skin's response to the treatment increases at different rates depending on the rela- tive irritancy potential of the bar. Table II provides a summary of four studies com- paring bars with varying degrees of relative irritancy potential. The increase in mean

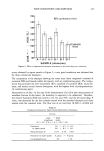
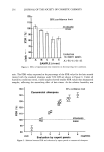
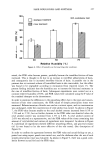
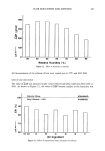
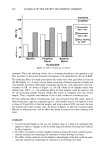
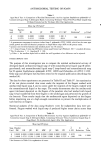
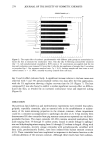
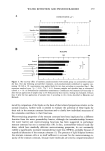
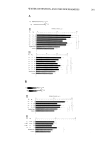
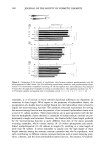
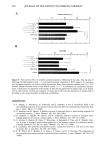
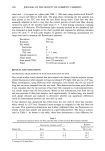
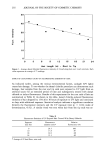
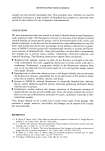
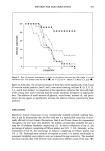
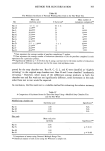
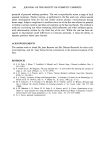
302 JOURNAL OF THE SOCIETY OF COSMETIC CHEMISTS Table II Summary of Erythema Scores Evaluation number Ave. # 4 8 12 16 20 Test Washes (Day 1) (Day 2) (Day 3) (Day 4) (Day 5) Bar A 19 2.0 4.5 4.5 6.5 6.5 Bar H 18 4.5 7.0 10.0' 11.5 12.5 Bar A 18 0.0 2.0 7.0 7.5 8.0 Bar I 14 0.5 11.0'* 21.5'* 21.5'* 23.0** Bar A 20 0.5 1.5 3.0 3.5 6.5 Bar B 10 4.0* 24.5** 31.0'* 32.0** 32.5** Bar A 20 0.5 1.0 4.0 7.0 9.5 Bar E 12 3.0** 20.5** 26.5** 32.0** 32.5** All endpoint scores of 2.00 or greater were carried through for remaining evaluations. Values presented are informational only. Statistical analysis was performed using a Wilcoxon matched pair test. * Significantly different at p 0.05. ** Significantly different at p 0.01. total score shows the rate of development of the observed irritation. The average number of washes is the number that could be conducted with that product before a moderate response (Grade 2) was elicited. Bar B develops a response quickly, with the average score approaching the maximum value by the twelfth evaluation (day 3). Milder bars H and A exhibit a gradual increase in response without the sites reaching the maximum endpoint score. The four-hour rest period between the third daily wash and the final daily evaluation allows the response to develop, resulting in the highest daily score. Recovery of the test sites occurs during the sixteen-hour overnight rest period between consecutive wash days. This results in plateaus in the response curve. Graphic representation (Figure 2) shows the sigmoidal pattern that typically becomes more prominent as the irritancy potential of the bar increases. Use of more irritating bars results in fewer survivors (less than Grade 2) at any time. Figure 2 also shows that repetitive testing of a bar produces very similar response curves in tests during different seasons. This absence of seasonal variation and the reproducibility of the flex wash test is shown in Figure 3. The graph shows the mean total erythema score obtained for two products of different relative irritancy potentials over a fourteen-month time period. Mean scores for bars A and B were 5.7 --- 1.2 and 27.7 -+ 2.0, respectively. The percent of pan- elists completing the study is also very consistent, with 93% --- 6% completing the studies with bar A and 5% --- 3% completing testing with bar B. Eleven marketed personal washing bars were directly compared to bar A using the flex wash test. The percentage of survivors and the mean number of evaluations completed for each personal washing bar is shown in Table III. Statistical analysis of the data indicates that all the bars tested were significantly more irritating than bar A based on the Wilcoxon matched pairs test. The sign and survival test also showed significant differences between all comparisons except A vs H. There were no cases where the subjects reached an endpoint score in the bar A-H comparison. Statistical analyses were only conducted on the bars that were directly compared.
Purchased for the exclusive use of nofirst nolast (unknown)
From: SCC Media Library & Resource Center (library.scconline.org)