J. Soc. Cosmet. Chem., 43, 69-83 (March/April 1992) Determination of 18 I-glycyrrhetinic acid and its phytosome in cosmetics by derivative LJV spectrophotometry and liquid chromatography (I-IP/C) V. ANDRISANO, V. CAVRINI, and G. SCAPINI, Dipartimento di Scienze Farmaceutiche, Via Belmeloro 6, 40126 Bologna, Italy. Received June 30, 1991. Synopsis First-order and second-order derivative spectrophotometric methods are proposed for the determination of 18 [3-glycyrrhetinic acid (GT) and its phytosome (GTP) in cosmetic formulations (creams and hydrophilic gels). The methods involve preliminary liquid-liquid extraction procedures to eliminate the interferences from the formulation excipients. The extraction steps and the results obtained were verified by a reversed- phase liquid-chromatographic (HPLC) method. The spectrophotometric method proved to be suitable for a reliable quality control of cosmetic formulations containing •0.3% of GT, while the HPLC method was found to be of general application. INTRODUCTION 18 •-Glycyrrhetinic acid (GT) is the aglycone of glycyrrhizinic acid (GZ), the most important component of licorice extracts. The compound is widely used in cosmetics (1,2) and pharmaceuticals (3) for its antiinflammatory properties, due to its inhibitory action on arachidonic acid metabolism (4). Because of its lipophilic character, GT can be used generally in O/W and W/O emul- sions and in oil-based cosmetics such as lipogels, ointments, and anhydrous pastes. Recently the 18 glycyrrhetinic acid phytosome (GTP) has been introduced for cosmetic use (1). It is described as a complex between purified soya phospholipids and GT, dispersible in water, and used also in water-based formulations such as hydrophilic gels. Analytical methods for the analysis of GT include colorimetric (5) and several HPLC (6-9) procedures. In order to provide alternative selective methods suitable for a prac- tical quality control of cosmetic preparations, derivative UV spectrophotometry was applied. Derivative spectrophotometry is a well established technique for resolution enhance- ment it allows selective discrimination of sharp bands over broad bands in UV spectra, offering an effective approach to the suppression of broad-background matrix absorption (10-12). Thus, in the present study, first and second derivative UV spectroscopy was applied to the determination of GT and GTP in commercially available cosmetic for- 69

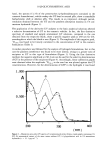
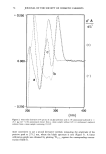
70 JOURNAL OF THE SOCIETY OF COSMETIC CHEMISTS mulations (creams and hydrophilic gels), and the results were compared with those obtained by a reference HPLC method. EXPERIMENTAL MATERIALS 18 •-Glycyrrhetinic acid (GT) was obtained from Aldrich Chemie (Switzerland) and glycyrrhetinic acid phytosome (GTP) from Indena (Gruppo Inverni della Beffa, Italy). Testosterone acetate (internal standard) was from Sigma (St. Louis, MO). Methyl, ethyl, propyl, and butyl p-hydroxybenzoates, butylhydroxyanisol (BHA), butylhydroxytoluol (BHT), and sodium dehydroacetate were supplied by Formenti (Italy). Imidazolidinyl urea (IMU) was from Medolla (Milan, Italy). Acetonitrile was obtained from Promo- chem (F. R.G.), and water was deionized and double-distilled. Aqueous 0.02 M phosphate buffer solutions (pH 3.0) were prepared by mixing potas- sium dihydrogen phosphate and phosphoric acid solutions in the proportion required to give the desired pH value. The GT (0.5 mg ml-•) and GTP (1.5 mg ml-•) stock solutions in 1% ammonium hydroxide and methanolic 1% potassium hydroxide were found to be stable for more than one month at room temperature. The testosterone acetate solution (0.1 mg ml-•) was prepared in the mixture acetoni- trile:phosphate buffer (0.02 M pH = 3.0) 60:40 (v/v), as were the solutions of the single preservants and antioxidants. APPARATUS All the spectrophotometric analyses were performed on a Jasco UVIDEC-610 double- beam spectrophotometer, using 1-cm quartz cells with a slit width of 2 nm. The working settings were scan speed 100 nm min- • and chart speed 20 nm cm- • over the range 500-200 nm. For the derivative mode, A}X = 5 nm was selected, and absorbance scale expansion x 5 (first derivative mode) and x 15 (second derivative mode) were used. The HPLC apparatus consisted of a Waters 501 solvent delivery system, an on-line ERMA ERC-3312 degasser, a Rheodyne sample injection valve with a 20-}xl sample loop, a variable wavelength UV detector (model 481), and a data module 745. The detector wavelength was set at 248 nm, with the integrator attenuation at 16. A 250 x 4.5-mm I.D. column packed with 5-}xm Hypersil C18 was used at ambient temperature, using as mobile phase a binary mixture consisting of acetonitrile:0.02 M potassium phosphate buffer (pH = 3.0) 65:35 (v/v) or 60:40 (v/v) at a flow rate of 1.2 --1 ml min CALIBRATION GRAPHS First derivative method. The zero order UV spectra of GT (7.2-36 }xg ml-•) and GTP (30-150 }xg ml -•) standard solutions in 1% ammonium hydroxide were recorded, using 1% ammonium hydroxide as the blank. The first order spectrum was then derived. The amplitude of the negative peaks at }k = 248 nm and }k = 246.4 nm to the zero line, 1D248 and 1D246.4, were measured for GT standard solutions and GTP
Purchased for the exclusive use of nofirst nolast (unknown)
From: SCC Media Library & Resource Center (library.scconline.org)