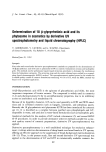
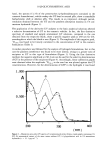
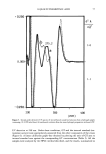
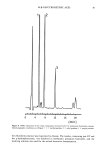
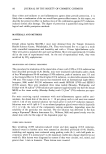
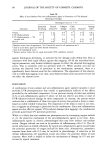
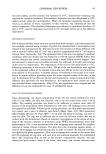
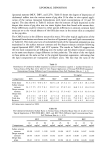
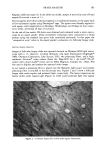
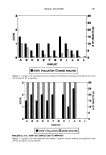
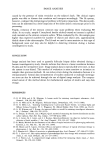
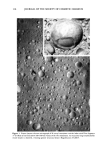
102 JOURNAL OF THE SOCIETY OF COSMETIC CHEMISTS •OLLICUL•R BIOPSY l•kV oe$D x155 D= 1 :•mm P = •.6T Figure 1. An ESEM (environmental scanning electron micrograph) of a follicular biopsy. over most of the field and 3, larger, globoid microcomedones over the entire field. This study showed that, although the human model was less sensitive, there was reasonably good correlation between the human and rabbit ear models. Recently, Mills et al. (3) compared black males and white females and found a good correlation between micro- comedone formation on the backs of these two groups. Image analysis (IA) has been used to evaluate skin surface topography (5-10), histology (11-14), and more recently, facial comedones by porphyrin fluorescence (15). We evaluated follicular biopsies by image analysis under polarized light. Polarized light has been effectively used for the photog- raphy of the skin (16) and consists of wavetrains whose planes of vibration are oriented in a parallel manner (17). METHODS AND MATERIALS CLINICAL STUDY The current study used a variation of the Mills and Kligman model. In the study the product was occluded on the upper backs of twelve white females with a history of acne. Each panelist was screened using the "follicular biopsy" technique, and a score of 1 or greater was required for inclusion in the test. The test was concluded in October of 1990. The test samples were: (A) a cleansing masque (B) a moisturizer (C) a positive control, acetylated lanolin alcohol (Acetulan©) and (D) a negative (no product) control. Test samples A and B were chosen because they were originally tested using the modified

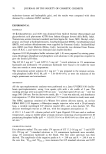
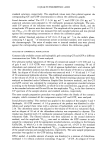
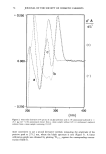
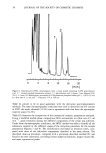
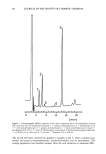
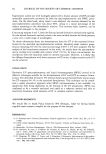
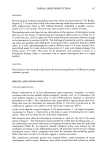
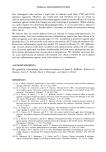
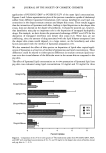
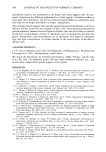
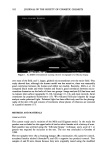
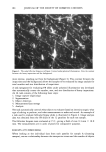
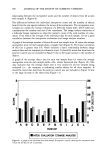
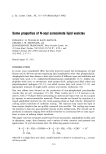
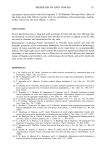
IMAGE ANALYSIS 103 Kligman rabbit ear assay (4). In the rabbit ear model, sample A received a score of 0 and sample B received a score of ! +. The test agents were blind coded and applied in a randomized manner on the upper back in five-centimeter squares using Dermapore © tape. The agents were liberally applied to each square, with reapplication on Mondays, Wednesdays, and Fridays for four consec- utive weeks, providing 28 days of occlusion. At the end of four weeks, FB slides were obtained and evaluated under a stereo micro- scope by an expert grader. These interpretive evaluations were conducted in a blind manner using the standard four-point scale mentioned previously. In this paper the "interpretive score" refers to the expert grader's evaluation of a follicular biopsy slide. DIGITAL IMAGE ANALYSIS Images of follicular biopsy slides are captured through an Olympus SZH light micro- scope with a ! x objective, overhead fiberoptic ring light illumination (Highlight © 3000, Olympus Corporation, Lake Success, NY), two polarizing filters, and a high- resolution Nuvicon © video camera (Series 68, Dage-MTI Inc.). An Intel © PC-AT system with a Joyce-Loebl © vision card set (Mini Magiscan, Compex Inc., Mars, PA) was used to digitize and analyze the captured video image. In our system a polarizing filter is placed over the fiberoptic light source and another polarizing filter is attached to the microscope lens. Figures 2 and 3 show a follicular biopsy slide under regular and polarized light, respectively. The horny impactions are barely visible under regular light (Figure 2), while under polarized light they appear Figure 2. A follicular biopsy slide viewed under regular illumination
Purchased for the exclusive use of nofirst nolast (unknown)
From: SCC Media Library & Resource Center (library.scconline.org)