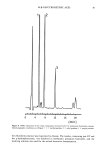
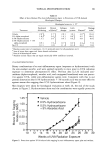
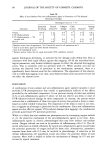
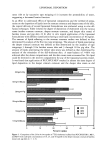
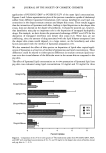
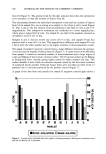
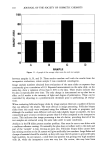
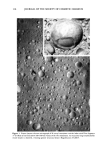
110 JOURNAL OF THE SOCIETY OF COSMETIC CHEMISTS Figure 11. A graph of the average object area for each test sample. between samples A, B, and D. These results correlate well with the results from the interpretive evaluations, where sample C was considered comedogenic. Image analysis numbers obtained from evaluations of the same slides on separate days consistently give a correlation of 0.9. Repeated measurements on the same slide, on the same day, show a variation of less than 0.10% in the data. These results indicate that IA data is reproducible over time. The only change in instrumental set-up that has an effect on IA results is the intensity of light and degree of polarization. These can be controlled by adjusting to a predetermined threshold prior to performing IA evalua- tions. When evaluating follicular biopsy slides by image analysis there are a number of factors that can influence the results. The most obvious is image processing. Follicular biopsy slides from this study were evaluated using five different IA tasks or programs, and although the numbers were different with each task (slightly larger or smaller), the data consistently gave a linear correlation greater than 0.9 when compared to the interpretive scores. This indicates that image processing is less of a factor, providing that all of the test samples are evaluated using the same task under to same conditions. Artifacts in the FB slides present another problem. One must be sure to use slides with a confluent adhesive coating. Occasionally the glue does not adhere well to the slide and part of the "sample" is lost, leaving an open area. Follicular biopsy slides cannot have any missing sections or the IA system will give artificially low numbers. Large flakes and clumps of material should be avoided, as they will cause the IA system to give artificially high numbers. In one instance, a slide from one panelist was getting very high numbers with IA, while the interpretive score was very low. On review, this may have been

IMAGE ANALYSIS 111 caused by the presence of tiniea versicolor on the subject's back. The clinical expert grader was able to discern this condition and interpret accordingly. The IA system, however, confused the dermatological problem with horny impactions. The above prob- lems can be addressed by a brief inspection of the slides under a microscope prior to IA processing. Finally, irritation of the stratum corneum may cause problems when evaluating FB slides. In our study, sample C (acetylated lanolin alcohol) caused an increase in uplifted scaly material on the stratum corneum surface. When evaluated by IA, this sample gave higher than expected numbers for number of objects and object area, approximately double those of the other samples. The IA task we used is more sensitive to this type of background noise and may also be helpful in detecting irritation during a human comedogenicity study. CONCLUSION Image analysis has been used to quantify follicular biopsy slides obtained during a human comedogenicity study. Results indicate that there is a linear correlation between IA data and the interpretive score. Image analysis data is reproducible over time, in that the system is non-biased. This method of evaluation is more sensitive to irritation on samples than previous methods. IA can reduce errors during the evaluation because it is semiautomated. Central data interpretation of studies conducted at multiple investiga- tor sites can also be achieved through the use of digital image analysis. The comput- erized nature of this method allows for mathematical analysis of results and easy data storage. REFERENCES (1) O. H. Mills and A.M. Kligman, A human model for assessing comedogenic substances, Arch. Dermatol., 118, 903-905 (1982). (2) O. H. Mills and A.M. Kligman, Follicular biopsy, Dermatologica, 167, 57-63 (1980). (3) O. H. Mills et al., "Assessing Comedogenicity: Current and Future Trends," in Clinical Safety and Efficacy Testing of Cosmetics, W. C. Wagginer, Ed. (Marcel Dekker, New York, 1990), pp. 83-91. (4) A. M. Kligman and T. Kuong, An improved rabbit ear model for assessing comedogenic substances, Br. J. Dermatol., 100, 699-702 (1979). (5) A. Awajan, D. Rondot, and J. Mignot, Quick method of measuring the furrows distribution on skin surface replicas, Med. Biol. Eng. Comput., 379-389 (July 1989). (6) G. L. Grove, M. J. Grove, and J. J. Reydon, Optical profilemetry: An objective method for quan- tiffcation of facial wrinkles, J. Am. Acad. Dermatol., 213, 631-637 (1989). (7) R. Marks, Methods for the assessment of the effects of topical retinoic acid in photo-aging and actinic keratosis, J. Int. Med. Res., 18, 29C-34C (1990). (8) M. Monto and R. Caputo, Chemical efficacy and patient tolerance of topical trentinoin therapy in photo-aging, J. Int. Med. Res., 18, 35C-40C (1990). (9) J. Bhawan et al., Effects of trentinoin on photodamaged skin, Arch. Dermatol., 127, 666-672 (1991). (10) G. L. Grove et al., Skin replica analysis of photodamaged skin after therapy with trentinoin emollient cream, J. Am. Acad. Dermatol., 25, 231-237 (1991). (11) T. J. Flotto et al., A computerized image analysis method for measuring elastic tissue, J. Invest. Dermatol., 93, 358-362 (1989).
Purchased for the exclusive use of nofirst nolast (unknown)
From: SCC Media Library & Resource Center (library.scconline.org)