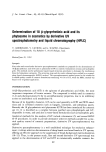
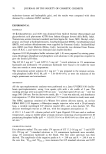
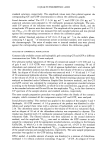
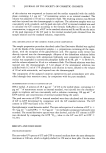
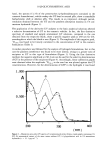
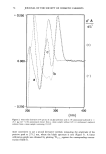
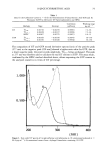
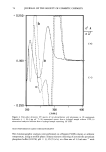
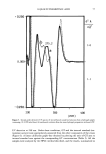
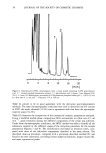
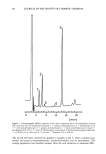
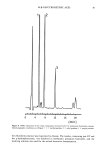
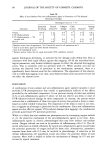
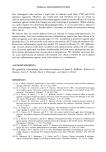
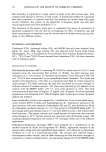
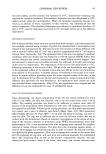
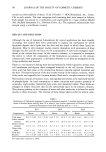
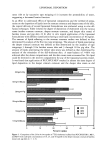
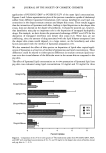
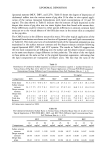
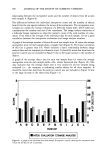
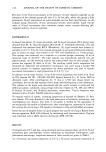
18 I3-GLYCYRRHETINIC ACID 73 hand, the spectra (13,14) of the preservatives (p-hydroxybenzoates contained in the cosmetic formulations), which overlap the GT band at neutral pHs, show a remarkable bathochromic shift at alkaline pHs. This results in an improved, although partial, resolution obtained between the GT and the parabens absorption maxima in 1% am- monium hydroxide (Figure 1). The application of the derivative UV analyses to the basic analytical solutions allowed a selective determination of GT in the cosmetic vehicles. In fact, the first derivative spectrum of standard and sample ammoniacal GT solutions, compared to the one obtained from the respective blank, show a specific negative peak at 248 nm for GT, wavelengths at which the blank is zero (Figure 2). The amplitude of this negative peak, •D248, was found to be linearly correlated to the concentration of GT in the cosmetic formulation (Table I). A similar procedure was followed for the analysis of hydrogels formulations, but in this case the parabens interference was found to be more intense, owing to a greater ratio of excipient to GT in this type of formulation (Figure 3). Using the first derivative method, the negative amplitude at 246.4 nm can be used for the selective determination of GT in the presence of the excipients (Figure 4). Accordingly, linear calibration graphs were obtained when the amplitude 1D246. 4 to the zero line was plotted against the GT concentrations. However, for the determination of GTP in the hydrogels it was found 1.000- c.. 0 500 ' I / : : •.' •l I ß I !"' ' I I I I I I 200 •00 •00 Figure 1. Absorption zero-order UV spectra of: (a) ammoniacal extract from a cream sample containing 1% GT (b) ammoniacal extract of the same cream without GT (c) glycyrrhetinic acid in 1% ammonium hydroxide (c -- 21. ! I•g ml- •).

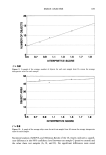
74 JOURNAL OF THE SOCIETY OF COSMETIC CHEMISTS + 0.250 - / ß : 0.000- 0.250 - I I I I I ! I : I I : I I I 200 300 400 (nm) Figure 2. First-order derivative UV spectra of: (a) glycyrrhetinic acid in 1% ammonium hydroxide (c = 21.1 }xg ml-•) (b) ammoniacal extract from a cream sample without GT (c) ammoniacal analytical solution from a cream sample containing 1% GT. more convenient to use a second derivative method, measuring the amplitude of the positive peak at 275.2 nm, where the blank spectrum is zero (Figure 5). A linear calibration graph was obtained by plotting 2D275. 2 against the corresponding concen- tration (Table I).
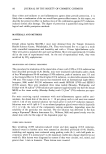
Purchased for the exclusive use of nofirst nolast (unknown)
From: SCC Media Library & Resource Center (library.scconline.org)