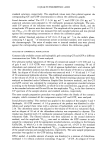
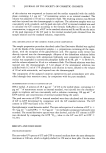
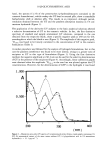
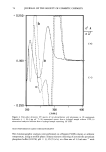
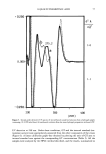
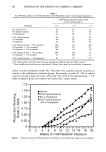
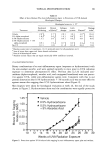
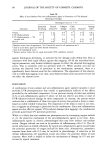
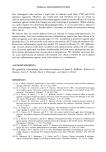
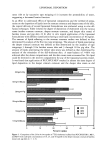
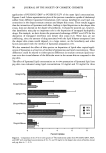
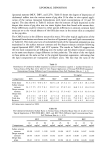
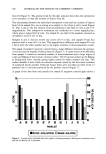
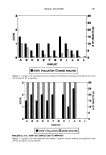
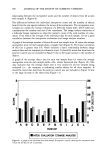
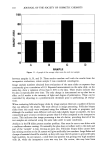
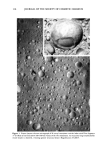
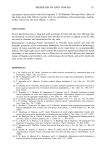
108 JOURNAL OF THE SOCIETY OF COSMETIC CHEMISTS relationship between the interpretive scores and the number of objects from IA as seen with sample A (Figure 8). The differences between the individual interpretive scores and the number of objects from IA for the test agents indicates the nature of the evaluations. The interpretive score is based on a subjective human evaluation of a follicular biopsy slide, which takes into consideration the number and size of the comedones. The image analysis evaluation of a follicular biopsy represents an objective numeric count of the total number of come- dones. If we look at the average of the individual data for each sample, we see a good correlation between the interpretive evaluations and image analysis numbers. A graph of the average number of objects for each test sample from IA versus the average interpretive score for each sample gives a straight line (Figure 9). The linear correlation of this line is greater than 0.9, which indicates a direct relationship between image analysis data and the interpretive evaluation scores. It should be noted that data from the positive control was not included in Figure 9 due to the large increase in the number of objects. A graph of the average object area for each test sample from IA versus the average interpretive score for each sample yields a flat, almost horizontal line (Figure 10). This data indicates that the average object area is very similar for all test samples being evaluated (i.e., the computer is evaluating similar objects for all three samples). It should be noted that data from the positive control was not included in Figure 10 due to the large increase in the object area (Figure 11). PANELIST • INTER. EVALUATION I•t IMAGE ANALYSIS J Figure 8. A graph of the individual data from sample D (negative control), showing the interpretive score versus the IA data for all 12 panelists.

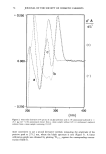
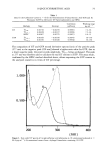
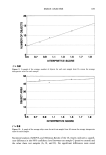
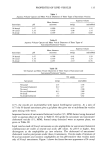
IMAGE ANALYSIS 109 20 15 10 0.5 0.7 0.9 '• .1] 1] .3 1] .5 1] .7 1] .9 •NTERPRET•VE SCORE r0.9 Figure 9. A graph of the average number of objects for each test sample from IA versus the average interpretive score for each sample. 50 ß ß • .................................................................. nv 30 .................................................................. o o 0.5 0.7 0.9 1] .'• 1] .3 1] .5 1] .7 1] .9 •NTERPRET•VE SCORE r0.9 Figure 10. A graph of the average object area for each test sample from IA versus the average interpretive score for each sample. Statistical analysis (ANOVA and Newman-Keuls) of the IA results indicates a signifi- cant difference at the 99% confidence level between test sample C (positive control) and the other three test samples (A, B, and D). No significant differences were noted
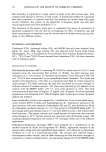
Purchased for the exclusive use of nofirst nolast (unknown)
From: SCC Media Library & Resource Center (library.scconline.org)