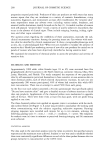
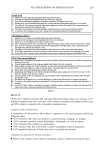
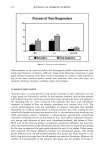
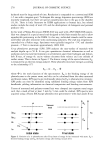
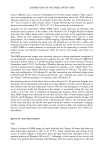
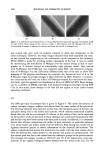
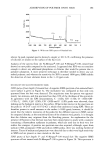
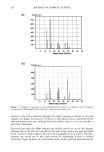
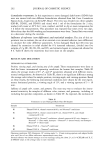
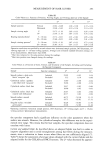
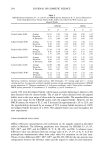
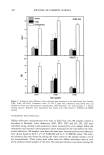
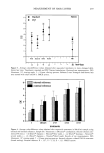
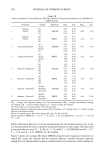
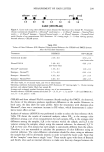
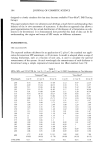
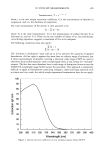
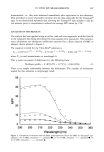
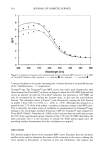
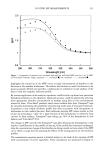
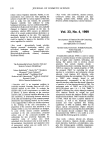
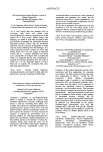
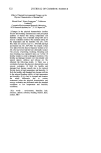
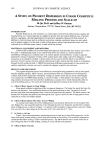
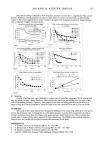
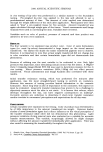
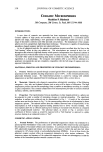
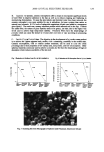
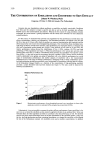
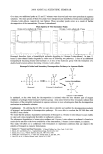
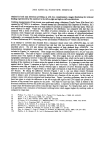
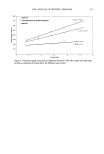
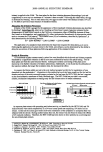
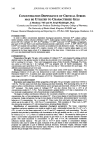
270 JOURNAL OF COSMETIC SCIENCE 25% of the non-sensitive skin group purchased products appropriate for sensitive skin. NEUROSENSORY RESPONSES With each probe, the time to onset was statistically significantly less in the sensitive skin group lactic acid stinging revealed the greatest difference between the two groups (see Figure 2). With each of the three probes, peak intensity was statistically significantly greater in the sensitive skin group (see Figure 3). Time to peak response (Table I) was statistically different for the balsam of Peru (30 seconds difference) and lactic acid (90 seconds difference) probes however, for the chloroform/methanol group the difference was less than 15 seconds on average and not statistically significantly different. The grade at onset of reaction (Table I) was higher for the sensitive skin group for each probe, but was significantly different only for the balsam of Peru and lactic acid groups. NON-RESPONDERS There were significant numbers of subjects who did not respond to any of the probes. Of particular interest is the number of sensitives who were non-sensitive (see Figure 4). OTHER OBSERVATIONS Selected demographic information noted an equal number of smokers in each group (approximately 24%). A higher percentage of the self-perceived sensitive skin group indicated having allergies (37% vs 19%) and being flushers/blushers (66% vs 40%). The self-perceived group had a slightly higher percentage of subjects with combination 10:00 Time to Onset - Burning/Stinging 8:00- 6:00- 4:00. 2:00- 0:00- 5:06 6:13 6:00 4:20 1:34 1:08 BP LA CHLOR ß Sensitive [] Non-Sensitive Figure 2. Time to onset of burning/stinging.

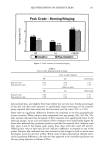
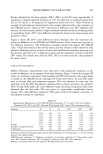
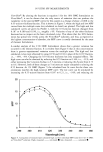
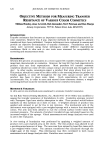
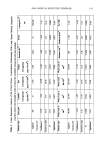
SELF-PERCEPTION OF SENSITIVE SKIN 271 Peak Grade- Burning/Stinging 1.45 1.09 2.20 2.00 0.92 0.58 LA BP CHLOR ] ß Sensitive [] Non-Sensitive I Figure 3. Peak intensity of burning/stinging. Table I Time to Peak Response/Grade at Onset Time to peak response BP LA Chlor/meth Sensitive skin 6:35 4:40 1:42 Non-sensitive skin 7:14 6:12 1:59 Grade at onset BP LA Chlor/meth Sensitive skin 0.84 0.71 1.43 Non-sensitive skin 0.69 0.49 1.36 (oily/normal) skin, and slightly fewer had neither dry nor oily skin. Similar percentages of dry and oily skin were reported. A significantly larger percentage of the sensitive group reported that their sensitivity had increased over the years (45% vs 14%). There were no significant differences between the responses at the five geographically diverse locations. When subjects were categorized into age groups (20s, 30s, 40s, 50s, 60s), analyses indicated that the balsam of Peru responses were significantly lower in the older age groups. Lactic acid and balsam of Peru responses were significantly higher for those who indicated they purchased products specified for sensitive skin. Subjects with skin types I and II had higher peak grades than those with skin types III and IV. Differing skin color or skin tone did not indicate a difference in response to any of the probes. Subjects who indicated that their sensitivity had changed a little or much more had higher scores for all three probes. While some of these observations showed statis- tically significant differences, the only one that appeared to be clinically significant was the age group response to balsam of Peru.
Purchased for the exclusive use of nofirst nolast (unknown)
From: SCC Media Library & Resource Center (library.scconline.org)