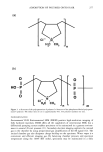
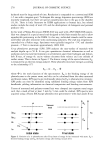
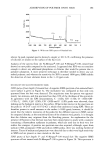
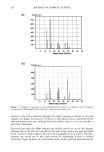
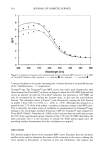
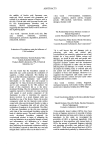
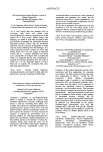
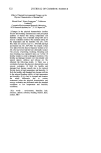
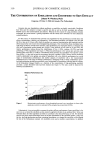
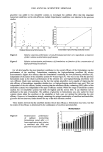
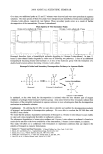
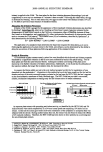
2000 ANNUAL SCIENTIFIC SEMINAR 333 Over time, two additional peaks at 3.3 and 3.7 minutes were observed and were more prevalent in aqueous solutions. The mass spectra of these two peaks were interpreted and identified as bromo-nitro-methane and 1-bromo-l-nitro-ethene, respectively (see below,}. These secondary peaks occur as a result of further decomposition of the intermediate, 2-bromo-2-nitroethanol. Mass Spectra of Two Secondary Peaks bromo-nitro-methane • 3.3min 1-bromo-l-nitro-ethene • 3.7m in Bronopol, therefore, loses a formaldehyde molecule degrading to 2-bromo-2-nitro-ethanol. In turn, 2- bromo-2-nitro-ethanol further degrades by either one of following two pathways: 1) loss of an additional formaldehyde becoming bromo-nitro-methane or 2) loss of the hydroxyl group with the formation of a double bond between carbons becoming 1-bromo- 1-nitro-ethene. Bronopol's Initial and Secondary Decomposition Pathways in Aqueous Media o o o o \x/ \\/ H N H H N ,• i I • i H-O-C-C-C -O -H ,• H-O-C-C-H H Br H H Br O O H-C-H I bromo-nitro-m•lhane N H Bronopoi 2-bromo-2-nitroethanol Br~C=C i % H H 1 -Bromo- 1 -nitro-ethene In methanol, on the other hand, the decomposition is initiated when the lone electron pair of oxygen withdraws a hydrogen from bronopol's hydroxy group. Area ratios between these two peaks indicate that the kinetics of the retroaldol mechanism in aqueous solutions is more advantageous than the decomposition mechanism in methanolic solutions. Conclusions: By utilizing the GC-MS, we were able to identify and confirm the decomposition products of bronopol, and postulate its decomposition pathways. We were able to correlate the GC-MS data with the HPLC assay results. We found that the primary degradation mechanism of Bronopol to 2-bromo-2-nitro-etha.nol occurs readily in water and is less energetically favorable in methanolic solutions. The subsequent degradation to bromo-nitro-methane and 1-bromo-l~nitro-ethene in methanol is found at a much slower rate due to the lower availability of the intermediate, 2-bromo-2-nitro-ethanol, in solution. This study will allow us to collaborate with formulators to implement conditions that can improve the stability of bronopol in cosmetic formulations. 1. Kabara, J.J., "Cosmetic and Drug Preservation." 1, Marcel Dekker, Inc., New York, 31-62, ]984. 2. Moore, K.E. and Stretton, R.J., d. Applied Bacteriology, 51,483-494, ]98]. 3. Sanyal, A.K. et. al., d. Pharm. Biotaed. AnaL, 14, 144%1453, 1996. 4. Challis, B.C. and Yousaf, T.I., J. Chem. Soc. Perkin Trans., 2, 283-286, ]99]. 5. Lian, H.Z. et. al., J. Pharm. Biotaed. AnaL, 15, 667-671, 1997.

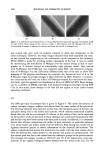
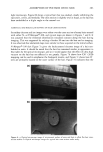
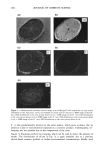
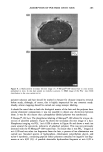
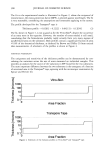
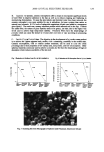
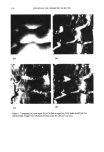
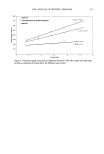
334 JOURNAL OF COSMETIC SCIENCE CORRELATION OF AFM/LFM WITH COMBING FORCES OF HUMAN HAIR Roger L. McMullen*', Stephen P. Kelty' and Janusz Jachowicz* •Department of Chemistry, Seton Hall University, South Orange, N J, and *International Specialty Products, Wayne, N J, Introduction Scanning Probe Microscopy (SPM) is a class of techniques used to study the surface properties of materials from the atomic to micron scale. Atomic Force Microscopy (AFM) and Lateral Force Microscopy (LFM) fall under the SPM umbrella of techniques. h• both these techniques, a sharp tip stylus is placed in contact with a surface to be investigated. In AFM, one obtains a topographical image by measuring the deflection of a soft cantilever, to which the tip is attached, as the tip is tastered over the surface. The cantilever deflections normal to the surface are representative of topographical surface features. In LFM, one measures the torsional twisting of the cantilever as it is tastered over the surface. These lateral cantilever deflections result from drag forces between the tip and sample surface. Although several AFM investigations on human hair fibers have recently appeared in the literature, to our knowledge, complementary LFM studies have not been forthcoming. However, there has been a limited amount of information reported concerning tlxe LFM of wool fibers in which different frictional domains were observed [1]. Within the realm of human hair fiber invest/gations, a considerable amount of interest has focused on quantifying the cuticle step heights [2,3], and characterizing the surface roughness of the morphological components of the cuticle, i.e. the exocuticle, endocuticle, and the A-layer [3]. Additionally, these studies have demonstrated the use of AFM to study hair at various degrees of hydmtion [1-4] and at a range of pH levels [4,5]. Other studies, primarily interested in the adsorption of cationic polymers onto hair, have also been completed [6-9]. Most recently, Parbhu et. al. used force-volume and nano-indentation techniques to measure the hardness and relative elastic moduli of the morphological components of the wool fiber [10]. Their results were in agreement with what one would expect considering the chemical composition of the various components of the wool fiber. We herein report combined AFM and LFM investigations of hair fibers as an analytical tool to correlate the wet combing force (obtained using a Miniature Tensile Tester) for bulk fibers. A comparison is made using both the surface topography (AFM) and the frictional force (LFM) obtained for a single fiber with the bulk fiber assembly. Hair that has been weathered (irradiation), chemically treated (bleached, permanent waved, or dyed), or thermally exposed (curling iron or hair dryer) experiences an increase in wet combing forces. Spatially Resolved Combing Analysis allowed us to observe an increase in inter-fiber friction, in the area of the hair t•ess, where the damaging treatment was administered. Methods & Results AFM and LFM studies were performed using an AutoProbe TM CP manufactured by Park Scientific Instruments. An AFM/LFM probe head was used in conjunction with a 100 gm piezoelectric scanner, operating in the contact mode. Commercial gold-coated Si3N4 cantilevers with pyramidal tips (microlevers) were used in the analysis. Hair fibers were mounted to steel sample studs using epoxy or nail polish. All data sets were collected in the contact imaging mode. During each scan, images were obtained for the topographic, error signal, left-to-right LFM, and right-to-left LFM measurements simultaneously. Subsequent data analysis was performed using Image Tool 2.0 (University of Texas Health Science Center in San Antonio). All image data presented in this report is raw and otherwise unfiltered. In normal operation, the difference between actual cantilever deflection and a reference setpoint is supplied to a feedback loop connected to the z-drive (height) of the scanner. The voltage supplied to the z-drive is the origin of the topographic image data and is sensitive to topographic surface features. The error signal image reflects the difference between tlxe actual cantilever deflection and the setpoint and is highly sensitive to changes in height. Consequently, we find that it is useful to monitor both the topographic and error signal simultaneously since they are complementary techniques. LFM data were
Purchased for the exclusive use of nofirst nolast (unknown)
From: SCC Media Library & Resource Center (library.scconline.org)