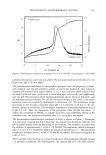
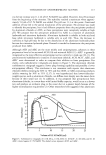
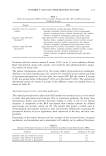
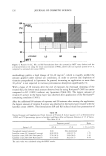
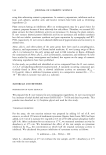
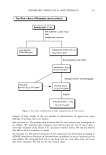
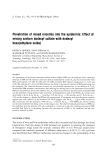
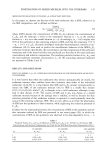
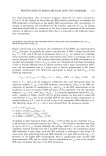
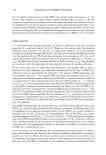
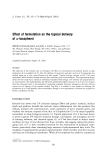
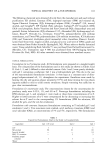
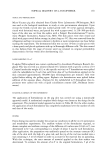
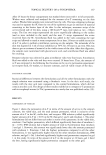
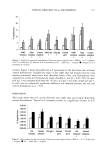
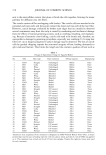
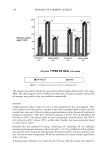
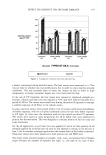
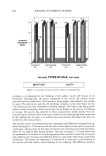
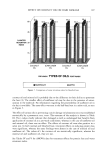
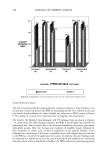
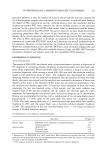
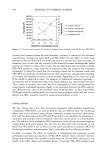
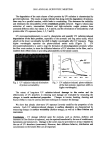
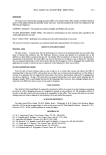
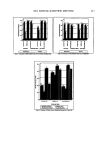
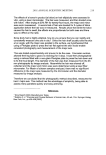
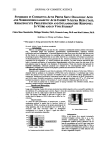
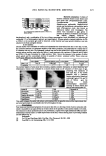
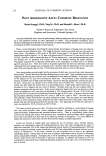
126 JOURNAL OF COSMETIC SCIENCE 120 - untreated LC RP RS eo J MTT Figure 4. Results for LC, RP, and RS formulations from the cytotoxicity MTT assay (below) and the activation/irritancy test using the tissue concentration of PGE 2 (above) after an exposure period of 0.5 h, compared to untreated skin areas (100%). methodology prefers a high dosage of 30-40 mg/cm 2, which is roughly tenfold the amount applied under normal use conditions, in order to prevent any depletion of vitamins encapsulated in liposomes. In general, increasing an application to more than 10 pl/cm 2 is not expected to increase percutaneous absorption significantly (3). With a lapse of 30 minutes after the end of exposure, by thorough cleansing of the treated skin, the lowest total amount observed was by using Roviparts © (58%) as carrier compared to LC (100%) without any liposomes (Table III). The largest amount of vitamin E acetate in the horny layer was observed after application of the Rovisome ©- containing emulsion (150%). After the additional 60 minutes of exposure and 90 minutes after starting the application, the largest amount of vitamin E acetate was observed in the horny layer treated with the lameliar cream (100%). The formulations RP and RS induced much less penetration of Table III Natural Amount and Supplemented Total Amount of Vitamin E Acetate (pg/per cm 2) as Determined by HPLC and UV Spectroscopy (given in brackets) and Ratio After an Exposure Duration of 1.5 h Versus That After 0.5 h Exposure period Ratio Strips 1-15 0.5 h 1.5 h 1.5 h vs 0.5 h Tocopherol (natural amount) LameIlar cream, LC (vitamin E acetate) Lameliar cream, RP (20% Roviparts ©) Lameliar cream, RS (20% Rovisome ©) 0.06 Not determined 30.0 (29.9) 34.6 (31.5) 1.15 17.6 (18.5) 24.0 (18.6) 1.36 45.4 (30.6) 20.2 (19.7) 0.44 The ratio value was calculated using the HPLC results.

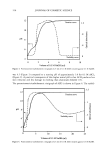
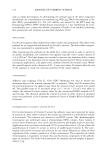
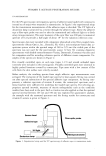
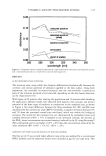
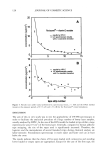
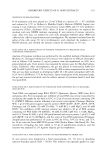
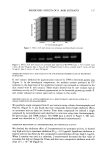
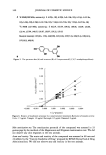
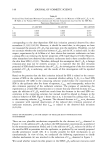
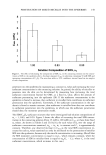
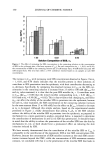
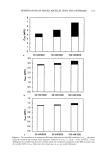
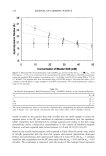
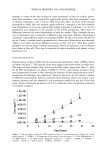
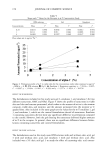
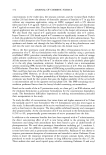
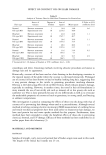
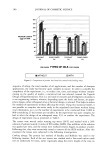
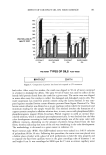
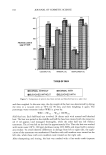
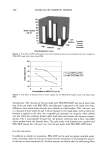
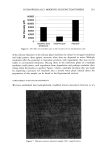
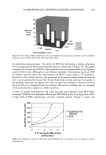
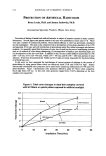
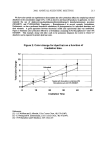
VITAMIN E ACETATE PENETRATION STUDIES 127 vitamin E acetate into the SC (69% and 58%, respectively). Independently of the formulation type and period of exposure, nearly 40% of the total amount of 15 strips was concentrated on the first strip. The amount of natural vitamin E was nearly 1000-fold lower than the supplemented amount. Again, about 50% were located on the first strip. The different kinetics for the formulations at the two time points were calculated as the differences between the two values analyzed. The ratio can be expressed as total amount at the exposure period of 1.5 h versus 0.5 h (see also Table III). Regarding the total transferred amount, a steady state was nearly reached after 0.5 h for the LC-treated skin. The creams containing microparticles/liposomes influenced the penetration efficiency for vitamin E acetate differently. In contrast to the effect when applying the RP formula- tion, a severe decrease in the total amount was observed for the formulation using Rovisome © as liposomes, as the ratio calculation indicates (see Table III). The Rovisome©-based formulation released a significant amount of vitamin E acetate into the horny layer within the short exposure period. Compared to the other formu- lations, the Rovisome©-containing cream only enables further penetration of vitamin E acetate into the lower epidermal layers after the additional exposure period. ADHESIVE TAPE STRIP ANALYSIS: SPECTROSCOPIC EVALUATION In Figure 2A, two representative transmission spectra of adhesive tape samples (average of five tape measurements) are shown. Under the recording conditions chosen, the spectra are similar, apart from some slight deviations just above 250 nm wavelength due to low intensities observed for the minispectrometer in the short-wavelength region. In the ensuing diagrams, UV spectra of cream formulation components (Figure 2B), and Rovisome © and Roviparts © (liposomes/microparticles) containing vitamin E acetate, as well as pure vitamin E acetate (Fig. 2C), are shown. UV spectra of adhesive tape samples loaded with stripped skin and pure tape were used to generate a difference spectrum for the corneocyte component, which mainly consists of bovine skin keratin (see Figure 3). In Figure 5, the comparison of the spectroscopic (mean, 2 x SD) and conventional (mean) results per strip (one udder) is shown for the RS cream after exposure periods of 0.5 h and 1.5 h, respectively. A major deviation between the two different types of evaluation can be observed on the first strip only. After the exposure period of 30 minutes, the total amount of vitamin E acetate (strips 1-15) analyzed by HPLC and spectroscopy was quite comparable for the samples taken after application of the LC and the RP, respectively. However, for the cream using Rovisome © as liposomal carrier, a significant difference was observed. Considering the total amount, about 33% less vitamin E acetate was determined in the horny layer by the spectroscopic assay than by the HPLC method. The difference between the two methods is reduced almost completely when the total amount is calculated without the values of the first adhesive tape strip taken. The detailed analysis (Figure 6) of the strips (first strip and collected strips) shows the results of both methods in a direct comparison. The averaged value of the first tape strip of the Rovisome © group measured by HPLC was more than twofold the value evaluated by spectroscopy. Except for this result, there was a substantial similarity in the means and the standard deviations evaluated by both analytical methods.
Purchased for the exclusive use of nofirst nolast (unknown)
From: SCC Media Library & Resource Center (library.scconline.org)