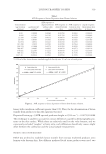
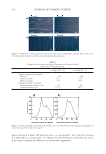
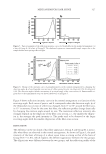
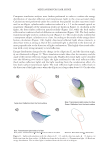
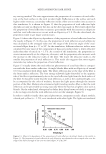
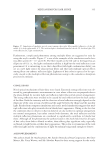
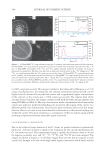
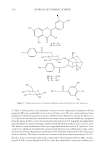
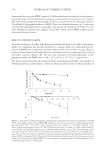
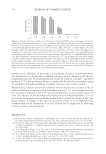
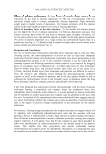
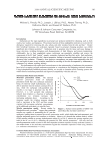
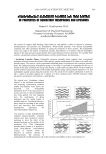
Cu AND Ca UPTAKE IN COLORED HAIR 339 Caucasian untreated mixed hair (natural white), obtained from a commercial source (IHIP, New York), was formed into swatches (16 cm, 1.5 g). The treated hair was obtained by treating the untreated hair with a commercial extra-light blonde shade that contained 4.5% hydrogen peroxide and ammonium hydroxide at a pH of 10. Four grams of the product was applied to each gram of hair. The product-covered hair was placed in an oven for 30 minutes at 30°C and then rinsed for 1 min in tap water containing about 300 ppm calcium and magnesium, and approximately 0.06 ppm copper. The hair was then washed twelve times using 0.1 g of a commercial shampoo. This whole process, involving one color and twelve washes, was repeated fi ve times to create the treated Caucasian white hair sample. The color- treated hair was placed under running tap water dosed with copper chloride (1 ppm) for 30 minutes to create the copper-rich sample. The hair was then dried in front of a fan. To create a fl at surface for NanoSIMS analysis, the hair was encapsulated within a resin matrix. The hair was cut into 2-cm lengths, placed in a shallow aluminium dish contain- ing medium-grade L.R. White resin, and fully coated in resin. Small bundles of resin- coated hair were positioned vertically in 1.5-ml Eppendorf tubes and polymerized in the oven at 70°C for 9 hr. The hair-containing resin blocks were then cut into sections of 0.5-μm thickness using a RMC powertomeXL ultramicrotome. The thin sections were placed on a droplet of water on a silicon substrate and warmed gently to give good adher- ence. All samples were gold coated to maintain conductivity in the NanoSIMS. HIGH-RESOLUTION SECONDARY ION MASS SPECTROMETRY The CAMECA NanoSIMS 50 can be operated with a Cs+primary beam to detect negative secondary ions, or with an O− primary beam to detect positive secondary ions. High- resolution ion images were obtained using the Cs+ primary ion beam, focused to approxi- mately 50 nm. The ion species 12 C−, 32 S−, 12 C14N−, and 40 Ca16O− were simultaneously mapped over an area of 5 × 5 μm, with 512 × 512 pixels in each image. The O− primary beam, with a resolution of about 300 nm, was used to map 40 Ca+ and 63 Cu+ over an area of 40 × 40 μm, with 256 × 256 pixels in each image. Each area was cleaned and implanted with the primary beam prior to image acquisition. To improve the counting statistics, fi ve sequential images were added together. INDUCTIVELY COUPLED MASS SPECTROMETRY Samples (0.5 g) were taken from each of the three types of hair, washed, and then analyzed using inductively coupled plasma-mass spectroscopy (ICP-MS). RESULTS AND DISCUSSION CALCIUM MAPPING: O- BEAM RESULTS In the fi rst set of experiments we investigated the use of the O− beam for chemical map- ping of both the uncolored and colored hair samples. The 40 Ca+ and 63 Cu+ images are shown respectively in Figure 1(a,b) for untreated hair and in Figure 1(d,e) for treated hair. The untreated hair shows an enhanced concentration of calcium in the cuticle region (~1000 counts per second) and also at the center of the fi ber, in the medulla region (2000

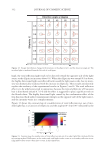
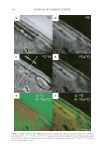
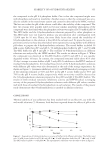
JOURNAL OF COSMETIC SCIENCE 340 to 3000 counts per second). This image is similar to that observed by Merigoux et al. (13) using x-ray fl uorescence. In comparison, the colorant-treated hair showed overall a much higher level of calcium all across the hair surface and a signifi cantly higher concentration of the calcium in the cuticle area (~7000 counts per second). The relative level of the calcium observed in these two images correlates well with the bulk calcium analysis data using ICP-MS (see Table I). The very clear increase in the concentration of calcium in the cuticle area indicates preferential binding sites located in this region of the cuticle vs a diffusion profi le, but unfortunately the relatively poor resolution achieved in this image does not allow us to come to any more detailed conclusions as to the precise binding sites within the cuticle. This poor resolution is a consequence of the low analyte signal and the resulting compromise between detectable signal resolution. CALCIUM MAPPING: Cs+ BEAM RESULTS Due to the relatively large diameter of the O− beam, its spatial resolution is intrinsically limited to ~200 nm. In order to improve the resolution for the calcium distribution, the Cs+ ion beam was used. This experimental setup is capable of resolutions down to 50 nm for negative secondary ions, and 12 C−, 32 S−, 12 C14N−, and 40 Ca16O− ions were mapped. The images are shown in Figure 2. In all these images there are two distinct regions in each cuticle cell, thought to be due to the high sulfur regions (exocuticle and A-layer) and the Figure 1. (a) NanoSIMS 40 Ca+ map obtained using the O− primary ion beam from untreated Caucasian hair. (b) NanoSIMS 63 Cu+ map obtained using the O− primary ion beam from untreated Caucasian hair. Bar = 10 μm. (c) NanoSIMS line profi les of the 40 Ca+ and 63 Cu+ signals obtained using the O− primary ion beam on untreated Caucasian hair. The line scan direction is indicated with an arrow in the 40 Ca+ image in (a). The 40 Ca+ ion signal has been offset by 500 counts per second for clarity. (d) NanoSIMS 40 Ca+ map obtained using the O− primary ion beam from treated Caucasian hair. (e) NanoSIMS 63 Cu+ map obtained using the O− pri- mary ion beam from treated Caucasian hair. Bar = 10 μm. The 40 Ca+ ion signal has been offset by 500 counts per second for clarity. (f) NanoSIMS line profi les of the 40 Ca+ signal obtained using the O− primary ion beam on treated Caucasian hair. The line scan direction is indicated with an arrow in the 40 Ca+ image in (d).
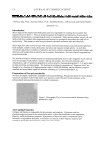
Purchased for the exclusive use of nofirst nolast (unknown)
From: SCC Media Library & Resource Center (library.scconline.org)