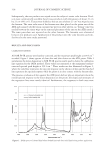
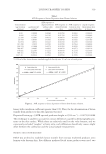
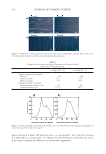
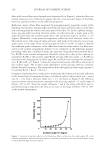
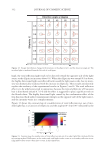
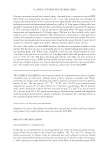
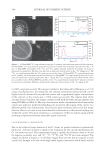
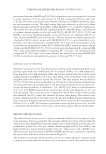
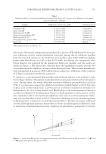
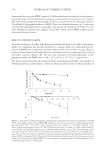
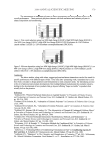
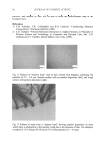
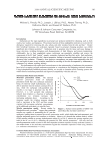
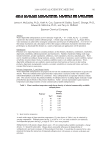
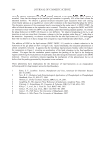
LOTION TRANSFER TO SKIN 319 linear, with correlation coeffi cients greater than 0.99. Thus, for the determination of lotion transfer from products to skin this equation was used: Deposited lotion μg = {(ATR spectral peak max height at 2914 cm−1) − 0.0071}/0.0088 This technique is unable to account for contact differences caused by dermatoglyphic pat- terns on the skin surface. While these are relatively small on the volar forearm, and we consciously excluded “rougher” or hairy arms, such differences should only cause a slight offset between the calibration and the actual sample measurement. PRODUCT TESTS ON HUMAN SKIN INSA was utilized to establish lotion transfer from various marketed products onto human volar forearm skin. Five different marketed facial tissue products were used: two Table I ATR Response to Lotion Deposition from Hexane Solution Concentration (μg lotion/g solution) μg lotion/cm2 prism* ATR response to deposited lotion without skin contact ATR response to cleaned forearm skin ATR response to lotion in close contact with skin Δ peak response (skin minus skin & lotion) 0.00 0.0000 -0.0086 0.01050 0.0063 -0.00420 9.666 0.3141 0.0136 0.01350 0.0229 0.00940 11.100 0.3607 0.0031 0.00670 0.0109 0.00420 26.439 0.8593 0.0100 0.00640 0.0182 0.01180 52.094 1.6931 0.0223 0.01030 0.0295 0.01920 101.298 3.2922 0.0556 0.00780 0.0564 0.04860 196.578 6.3888 0.0679 0.00450 0.0699 0.06540 289.487 9.4083 0.0893 0.00620 0.0973 0.09110 376.821 12.2467 0.1224 0.00530 0.1244 0.11910 789.311 25.6526 0.2204 0.01625 0.2176 0.20135 1227.36 39.9022 0.3593 0.00550 0.3555 0.35000 *0.250 ml of the lotion-hexane standards applied directly onto 10 cm2 zinc selenide prism. Figure 2. ATR response to direct deposition of lotion from hexane solution.

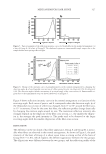
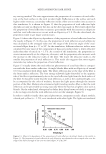
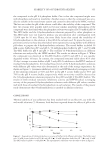
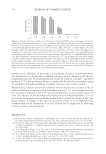
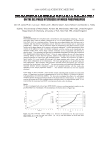
JOURNAL OF COSMETIC SCIENCE 320 non-lotioned and three lotioned products. For each product, 80 to 130 data points were collected from about 40 subjects. Large data sets were needed because some of the mar- keted lotioned products had a wide variation in the level of lotion on the tissue. These results are summarized in Table II. The relatively high standard deviations refl ect the total variation of lotion level within the tissue products (i.e., sheet-to-sheet difference), the variability in delivery of lotion from the tissue to the skin, possible skin lipid changes caused by mechanical action on the skin, and variation in the measurement. However, the measurement itself is quite good, as shown by the calibration curve linearity and high correlation (R2 0.99). Product 3 has the highest relative standard deviation (CV) of lotion delivered to the skin due to the high variation in lotion level on the tissue (due to machine variation in lotion applica- tion). In this case, we measured bulk lotion concentrations ranging from 3.99 to 5.77 g lotion/m2 subsrate. This high variation, from tissue to tissue, and the destructive nature of the bulk lotion concentration method (solvent extraction), prevented us from measur- ing the lotion transfer effi ciency (% transfer) for individual tissues. The wide variation in lotion amount, nearly 50%, on a marketed facial tissue (i.e., Product 3), necessitated a large sample size thus 80 to 130 data points per product were collected. Moreover, given the wide variation in lotion amount on each marketed product, one should expect a wide standard deviation in the amount of lotion transferred to the skin. Thus, in studies where the test products have a smaller variation in their lotion amount, a much smaller statistical variation in lotion transfer to the skin should be expected. CONCLUSIONS As expected, the two non-lotioned products delivered no lotion to the skin. The standard deviations may indicate surface changes to lipids that affected the spectrum to a small extent. The differences in lotion delivery to the arm are due to tissue lotion levels and lotion formulation differences. Product 3 delivered much less lotion to the skin than Products 4 and 5. The in vivo skin analysis described here is signifi cantly faster, simpler, and less invasive to the body than the tape stripping method described in the literature (1–3). INSA’s ability to quantify the deposition of compounds such as lotions onto human skin by products such as substrates and tonics, using ATR FT-IR, has been described. INSA’s utility was especially useful due to being noninvasive and nondestructive, which allowed Table II Average μg Lotion Deposited per cm2 of Volar Forearm Skin μg Lotion deposited per cm2 Non-lotioned tissue (Product 1) Non-lotioned tissue (Product 2) Lotioned tissue (Product 3) Lotioned tissue (Product 4) Lotioned tissue (Product 5) Average deposited -0.02 0.18 3.66 17.11 15.97 Standard deviation ±2.62 ±1.83 ±4.81 ±12.95 ±10.28 Relative standard deviation — — 131% 76% 64%
Purchased for the exclusive use of nofirst nolast (unknown)
From: SCC Media Library & Resource Center (library.scconline.org)