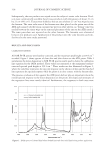
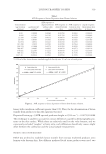
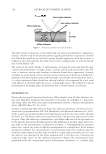
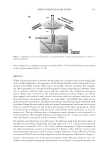
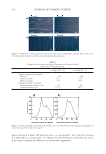
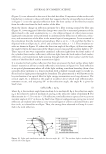
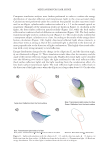
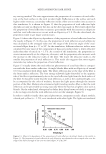
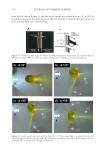
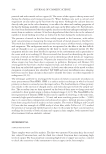
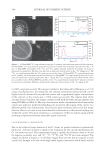
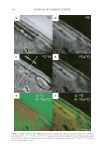
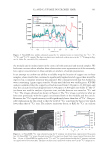
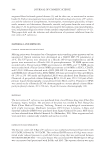
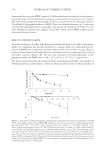
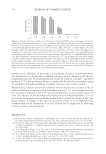
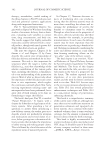
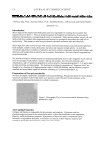
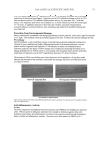
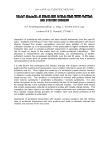
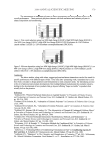
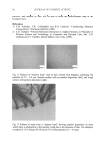
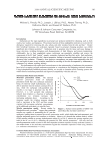
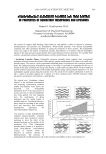
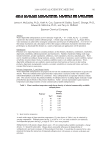
JOURNAL OF COSMETIC SCIENCE 340 to 3000 counts per second). This image is similar to that observed by Merigoux et al. (13) using x-ray fl uorescence. In comparison, the colorant-treated hair showed overall a much higher level of calcium all across the hair surface and a signifi cantly higher concentration of the calcium in the cuticle area (~7000 counts per second). The relative level of the calcium observed in these two images correlates well with the bulk calcium analysis data using ICP-MS (see Table I). The very clear increase in the concentration of calcium in the cuticle area indicates preferential binding sites located in this region of the cuticle vs a diffusion profi le, but unfortunately the relatively poor resolution achieved in this image does not allow us to come to any more detailed conclusions as to the precise binding sites within the cuticle. This poor resolution is a consequence of the low analyte signal and the resulting compromise between detectable signal resolution. CALCIUM MAPPING: Cs+ BEAM RESULTS Due to the relatively large diameter of the O− beam, its spatial resolution is intrinsically limited to ~200 nm. In order to improve the resolution for the calcium distribution, the Cs+ ion beam was used. This experimental setup is capable of resolutions down to 50 nm for negative secondary ions, and 12 C−, 32 S−, 12 C14N−, and 40 Ca16O− ions were mapped. The images are shown in Figure 2. In all these images there are two distinct regions in each cuticle cell, thought to be due to the high sulfur regions (exocuticle and A-layer) and the Figure 1. (a) NanoSIMS 40 Ca+ map obtained using the O− primary ion beam from untreated Caucasian hair. (b) NanoSIMS 63 Cu+ map obtained using the O− primary ion beam from untreated Caucasian hair. Bar = 10 μm. (c) NanoSIMS line profi les of the 40 Ca+ and 63 Cu+ signals obtained using the O− primary ion beam on untreated Caucasian hair. The line scan direction is indicated with an arrow in the 40 Ca+ image in (a). The 40 Ca+ ion signal has been offset by 500 counts per second for clarity. (d) NanoSIMS 40 Ca+ map obtained using the O− primary ion beam from treated Caucasian hair. (e) NanoSIMS 63 Cu+ map obtained using the O− pri- mary ion beam from treated Caucasian hair. Bar = 10 μm. The 40 Ca+ ion signal has been offset by 500 counts per second for clarity. (f) NanoSIMS line profi les of the 40 Ca+ signal obtained using the O− primary ion beam on treated Caucasian hair. The line scan direction is indicated with an arrow in the 40 Ca+ image in (d).

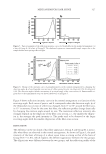
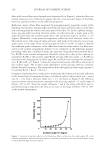
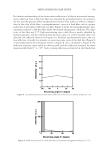
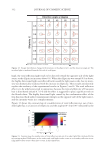
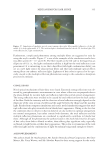
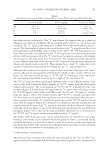
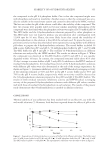
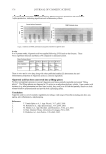
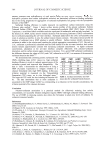
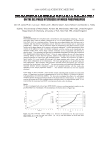
Cu AND Ca UPTAKE IN COLORED HAIR 341 low-sulfur regions (endocuticle). The 32 S− map (Figure 2b) supports this, as it shows an enhanced concentration of sulfur in the outer region of the cuticle, i.e., the A-layer and exocuticle. The 32 S− signal in the endocuticle is about 50% of that in the A-layer and exo- cuticle. The distribution of sulfur in the cuticle regions of the 32 S− map obtained here is in good agreement with the EELS study of sulfur in the cuticle (16). The high protein con- tent of the exocuticle is also refl ected in the 12 C14N− map [a species known to be generated at high yield from proteins (18)]. The 12 C− map shows the opposite variation, with a higher concentration in the endocuticle than the exocuticle. The composition of the endocuticle is very different from that of the exocuticle and consists of relatively large amounts of dibasic and diacidic amino acids (19). These regions have a high 12 C− signal due to the presence of molecules with multiple C–C bonds (see the 12 C− map in Figure 1a). Although the resolution is too poor to assign the location of metal binding in the cortex, cortical cells may be distinguished underneath the lamella of the cuticle of the hair (see Figure 2a). The cortical cells are high in 12 C14N− and 32 S− (see Figure 2a,b) compared to the surrounding intercellular material, which is high in 12 C− (see Figure 2a). The 40 Ca16O− map also shows signifi cantly different yields in the different regions of the cuticle cells, with a distinctly higher number of 40 Ca16O− counts from the outer region (A-layer and exocuticle. The co-localization of 40 Ca16O− and 32 S− is illustrated in the color overlay in Figure 2f. In this image the signal from the 32 S− ions is color-coded in green and the 40 Ca16O− signal is color-coded in red. Where the 40 Ca16O− and 32 S− signals are overlap- ping, the signal is yellow. The overlay confi rms that 40 Ca16O− is strongly associated with 32 S− in the outer cuticle region, as no signifi cant areas of red are observed. If the same proce- dure is carried out using the 12 C− signal as the green color and the 40 Ca16O− signal as the red color, then the image in Figure 2e is obtained. It is clearly seen that the calcium does not coincide with the location of the 12 C− signal, as clear areas of red are observed. A line scan across the cuticle (see Figure 2c for location of the line scan) was obtained for each of the four ion signals. Figure 3 shows the four line scans, and further emphasizes the co-localization of the 40 Ca16O− and 32 S− signals and the inverse behavior of the 12 C− signal. The higher yield of calcium in the cuticle sulfur-rich areas for colored hair may imply binding of the metals to the sulfonate functional group of cysteic acid formed during oxidation. However, it is more likely that as a result of oxidation a charge rearrangement has taken place between the sulfonate and carboxylate groups and that it is the carboxylic acid groups that are involved in the binding (20,21). COPPER MAPPING: O- BEAM RESULTS The chemical maps in Figure 1(b,e) show the maps obtained for the 63 Cu+ ion. The 63 Cu+ signal intensity was extremely low, and what signal there is appears to be concentrated in Table I Bulk Analysis Data from ICP-MS for Natural White, Colored White, and Copper-Rich White Hair Untreated (mg/kg) Treated (mg/kg) Copper-rich (mg/kg) Mg 160 ± 24 130 ± 20 150 ± 23 Ca 1300 ± 195 8700 ± 1300 4800 ± 720 Fe 19 ± 3 No data 7 ± 1 Cu 12 ± 2 120 ± 18 11000 ± 1650
Purchased for the exclusive use of nofirst nolast (unknown)
From: SCC Media Library & Resource Center (library.scconline.org)