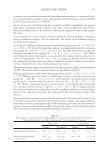
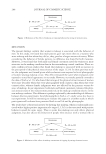
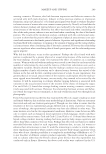
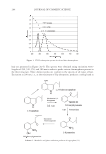
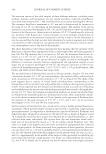
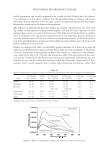
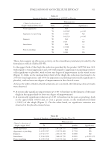
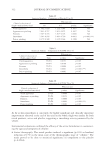
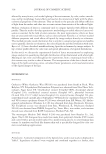
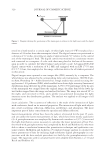
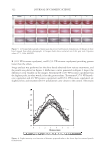
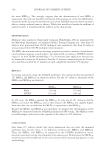
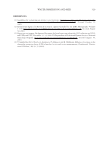
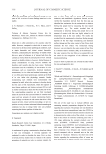
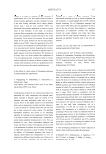
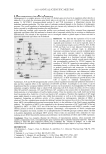
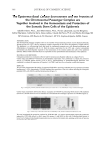
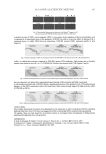
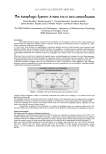
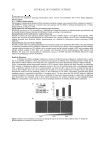
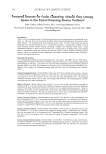
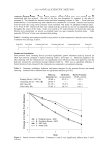
EVALUATION OF LIPSTICK LUSTER 321 Stamm et al. (5) proposed a luster parameter based on the specular and diffuse refl ectance area under the curve: - = Stamm S D L S (1) Reich and Robbins (6) offered a slightly different relationship to defi ne luster: R S L D W1/2 -R = ´ (2) where S represents the area underneath the specular curve, D represents the area under- neath the diffuse curve, W1/2 represents the width of the specular peak at half of its max- imum intensity, and L represents luster or shine. A schematic describing the specular and diffuse refl ectance is presented in Figure 2. Statistical analysis. Normality of the data was checked using the Wilk-Shapiro test, and equality of variance was checked using Bartlet’s test. When normality failed, a Kruskall- Wallis non-parametric evaluation was performed along with a Dunnett’s test to compare multiple treatments to a control. When equality of variance failed, a Dunn’s test was performed to compare multiple treatments to a control. Statistical analysis was performed using Sigma Plot 11 software (Systat Software, Inc., San Jose, CA). RESULTS Figure 3 provides digital photographs of treated lips with the formulations tested, the cropped photographs with the shine bands, and the converted 8-bit gray scale images. It is very noticeable from the images that differences among treatments are more noticeable in the cropped image than in the full-lip images however, gray scale images accentuate the differences the most. Based on visual observations, it can be seen that all treatments had more shine than the control, with treatment D (5% polybutene) being the least dif- ferent and treatments C (7% VP/hexadecene copolymer and 4% VP/eicosene copolymer), Figure 2. Schematic of the calculation of the luster parameter, which shows the difference between specular and diffuse refl ectance.

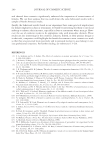
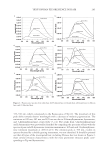
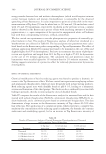
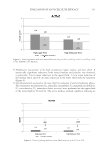
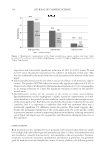
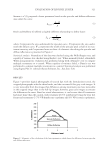
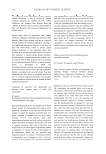
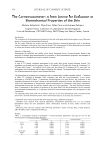
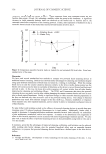
JOURNAL OF COSMETIC SCIENCE 322 B (11% VP/eicosene copolymer), and E (5% VP/eicosene copolymer) providing greater luster than the others. Image analysis was performed on the shine bands obtained from various treatments, and the results are plotted in Figure 4. Refl ectance curves generated in Figure 4 depict the differences seen visually on the images. Treatment B (11% VP/eicosene copolymer) has the highest peak in other words, it has the greatest shine. Treatments C (7% VP/hexade- cene copolymer and 4% VP/eicosene copolymer) and E (5% VP/eicosene copolymer) are slightly lower, and treatment D (5% polybutene) came closest to the control. The results Figure 3. (a) Cropped photographs of mannequin lips treated with lipstick formulations. (b) Images of shine band cropped from above photographs. (c) Images shown were converted into 8-bit gray scale. Exposure values: f/7.1, 1/80s, 800 ISO. Figure 4. Light intensity as a function of distance perpendicular to the lower lips for various lipstick formulations.
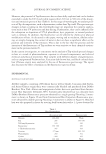
Purchased for the exclusive use of nofirst nolast (unknown)
From: SCC Media Library & Resource Center (library.scconline.org)