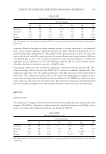
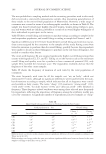
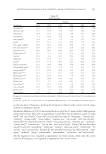
JOURNAL OF COSMETIC SCIENCE 168 The terms “artifi cial” and “strong smell” were used to describe the three creams with low- est overall liking scores (CE2, CE3, and CE5), suggesting that respondents disliked these fragrances, in contrast with the cream with the highest overall liking (CE4), described in terms of, inter alia, “natural” and “mild smell.” CLUSTER ANALYSIS The data suggested the existence of sub-groups of consumers with different perceptions of the fragrances tested, within the sample of respondents used in this study. Hierarchical cluster analysis was carried out on the overall liking data, leading to the identifi cation of Clusters 1 and 2, composed of 22 and 41 consumers (35% and 65% of the consumer sam- ple), respectively. Mean overall liking scores according to cluster are shown in Table III. Signifi cant differences (p = 0.0012) were found between the overall liking scores assigned by Cluster 1 to the fragrances of the tested creams. Overall liking ratings among respon- dents in this cluster were signifi cantly higher for cream CE4 than for CE6 and CE1. Samples CE4, CE2, CE3, and CE5 received scores above the minimum threshold for com- mercial potential. Highly signifi cant differences (p 0.0001) were found in Cluster 2 between overall lik- ing scores assigned to the samples, with CE6 and CE4 receiving signifi cantly higher scores than CE5 and CE2. Overall liking scores assigned by this cluster to the samples were consistently below the minimum commercial potential threshold, suggesting that Cluster 2 respondents did not like the fragrances tested. It is also possible to assume that Cluster 2 respondents did not regard the fragrance of the creams as an important sensory attribute for a cosmetic cream, as other sensory factors (color, texture) and non-sensory factors (packaging, brand, price) may have greater implications for the overall liking of a fragrance (2,5). This could be the subject of future research. No signifi cant differences between clusters (p 0.05) were found for any of the socioeco- nomic variables surveyed. However, a signifi cant difference was found in the frequency of use of face cream (χ2 = 6.643, p = 0.036), with Cluster 1 respondents using face creams more frequently than those of Cluster 2. Whereas in Cluster 1, 32% always used face creams and only 5% used them only occasionally, in Cluster 2, only 12% were frequent users and 27% used them only occasionally. Consumers more accustomed to using face creams assigned higher overall liking scores to the cream samples tested than less fre- quent users of face creams. CATA QUESTION Tables V and VI show, for the two clusters, frequency of mention for each of the CATA terms. Cluster 1 respondents used 30 terms to describe the samples, while Cluster 2 used 24, considering only those terms mentioned by more than 10% of the respondents in each cluster. The terms used exclusively by Cluster 1 were the majority of the affective terms proposed (“beautifying,” “glamorous,” “must-have,” and “for pampering oneself”) as well as “healthy,” “expensive,” and “winter use.” These attributes may be associated with emotional

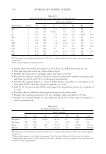
SELECTION OF FRAGRANCE FOR COSMETIC CREAM CONTAINING OLIVE OIL 169 aspects and cost factors, and may be related to the higher consumption frequency of face creams in this cluster. Cluster 2 used the term “disagreeable smell,” which was not used by Cluster 1, confi rming that dislike of a cream’s fragrance can strongly infl uence its acceptability (8). Signifi cant differences (p ≤ 0.05) were found for 10 of the 30 CATA terms used by Cluster 1. The cream with fragrance E4, which had the highest overall liking score, was described mainly in terms of “nourishing,” “softening,” “fresh,” “for older women,” “daytime use,” Table V CATA Results for Cluster 1 Attribute Sample CE1 CE2 CE3 CE4 CE5 CE6 Nourishing* 13.6 22.7 31.8 54.5 40.9 31.8 Moisturizingns 18.2 27.3 31.8 45.5 22.7 36.4 Softening* 9.1 31.8 36.4 50.0 18.2 31.8 Energizingns 13.6 31.8 13.6 9.1 9.1 27.3 Beautifyingns 4.5 0.0 4.5 13.6 9.1 9.1 Anti-agingns 13.6 4.5 13.6 18.2 27.3 4.5 Anti- wrinklens 4.5 0.0 13.6 13.6 9.1 4.5 Fresh** 9.1 36.4 18.2 40.9 18.2 59.1 Healthyns 0.0 13.6 9.1 13.6 13.6 9.1 For young women* 18.2 22.7 9.1 27.3 18.2 50.0 For older women* 31.8 22.7 22.7 40.9 54.5 18.2 Daytime use* 13.6 50.0 27.3 40.9 27.3 54.5 Night time usens 31.8 13.6 22.7 18.2 18.2 27.3 Naturalns 13.6 9.1 27.3 40.9 27.3 31.8 Artifi cialns 22.7 22.7 18.2 4.5 18.2 18.2 Cheapns 31.8 22.7 27.3 18.2 36.4 18.2 Expensivens 4.5 0.0 13.6 18.2 9.1 13.6 Glamorousns 9.1 0.0 0.0 13.6 4.5 4.5 Delicious smell** 18.2 45.5 31.8 72.7 45.5 45.5 Strong smellns 18.2 31.8 27.3 9.1 27.3 45.5 Mild smell* 27.3 22.7 40.9 45.5 22.7 4.5 Popularns 13.6 22.7 13.6 9.1 31.8 22.7 Summer use** 18.2 18.2 18.2 22.7 18.2 59.1 Winter usens 18.2 4.5 18.2 27.3 22.7 13.6 Use on feetns 4.5 0.0 18.2 0.0 13.6 9.1 Use on handsns 18.2 27.3 31.8 27.3 40.9 18.2 Facial usens 13.6 13.6 9.1 40.9 22.7 18.2 Use on bodyns 36.4 45.5 36.4 63.6 40.9 68.2 Must-havens 0.0 13.6 13.6 9.1 0.0 4.5 For pampering oneself* 4.5 13.6 0.0 22.7 4.5 0.0 Frequency of mention by attribute and sample. Only terms used by more than 10% of respondents are shown. *p ≤ 0.05, **p ≤ 0.01, ns: no signifi cant differences (p 0.05) according to Cochran’s Q test.
Purchased for the exclusive use of nofirst nolast (unknown)
From: SCC Media Library & Resource Center (library.scconline.org)