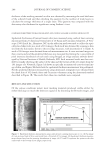
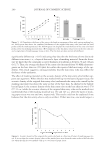
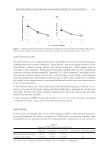
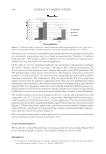
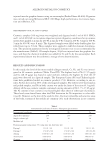
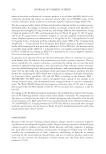
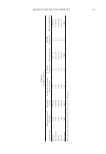
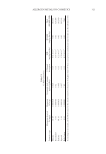
EQUIVALENCE EVALUATION OF MOISTURIZERS IN AD PATIENTS 299 to the questionnaire before using the preparation. Of the 50 subjects, following four were excluded from statistical analysis: two stopped coming to the hospital (control product group), one used steroid on subject’s own judgment to treat recurrence (control product group), and one discontinued use because of side effects, showing erythema and small papule in the test region 1 week after starting (moisturizing cosmetic group). EVALUATION OF EFFICACY AND SAFETY The usefulness of the test preparation was evaluated from the viewpoint of improvement, safety, dryness/desquamation, and pruritus. Results for improvement and safety are shown in Table IV. The number of subjects evaluated as “improved” or “somewhat improved” in both groups was almost the same. For safety, almost the same number of subjects evalu- ated as “safe” or “almost safe” was observed in both groups. No signifi cant difference was seen between the groups in improvement or safety. The results for dryness and desquamation are shown in Table II and trends during the trial are shown in Figure 1A. In both groups, the largest distribution range shifted from 2 points at the start of the trial to 0 points at the end of the trial (Table II). Signifi cant improvements were seen in dryness and desquamation score compared with the score before use in both groups. Although no signifi cant differences were seen between groups, no subjects showed 3 and 4 points in moisturizing cosmetic group. Evaluation of pruritus is shown in Table III, and trends during the trial are shown in Figure 1B. In both groups, score was centered around 1–2 points before the start of the Table I Age Distribution of Subjects Age (years) Number of subjects Overall Moisturizing cosmetic group Control product group 20–29 24 15 9 30–39 15 6 9 40–49 9 3 6 50–59 2 1 1 Mean age 32.3 ± 8.5 30.7 ± 8.2 33.9 ± 8.7 Table II Evaluation of Dryness and Desquamation Score Moisturizing cosmetic group Control product group Start of trial End of trial Start of trial End of trial 0 (none) 0 15 0 11 1 (slight) 5 3 5 8 2 (mild) 15 6 14 2 3 (moderate) 5 0 4 1 4 (severe) 0 0 2 0 Values represent the number of subjects.

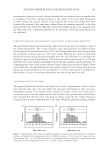
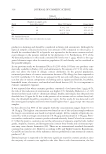
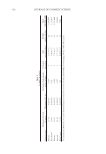
JOURNAL OF COSMETIC SCIENCE 300 trial, but the distribution shifted to 0 points by the end of the trial. Signifi cant improve- ment was seen in both groups compared with the score before the start of the trial. No signifi cant difference was seen between groups. EVALUATION OF STRATUM CORNEUM FUNCTION The TEWL value at the start of the trial in both groups showed the same distribution by Student’s t-test. Change in TEWL values between before and after use was evaluated (Table V). In both groups, TEWL value decreased in three subjects and rose in more than half of the subjects. The mean value before and after use signifi cantly changed in respec- tive groups. Mean difference value (ΔTEWL) between both groups showed no signifi cant difference. The distribution equality of moisture content at the start of the trial between both groups was confi rmed by Student’s t-test. Change in moisture content before and after use was also compared (Table VI). An increase in moisture content was seen in nearly 60% of subjects in both groups. Comparison of mean values before and after use showed that the moisture content was signifi cantly increased in respective groups. In a comparison of dif- ference of values (Δ moisture content) before and after use, no signifi cant difference was seen between groups. Table III Evaluation of Pruritus Score Moisturizing cosmetic group Control product group Start of trial End of trial Start of trial End of trial 0 2 15 2 12 1 11 4 10 8 2 12 5 11 2 3 0 0 2 0 4 0 0 0 0 Values represent the number of subjects. Table IV Evaluation of Improvement and Safety Improvement Safety Moisturizing cosmetic group Control product group Moisturizing cosmetic group Control product group Improved 15 13 Safe 23 22 Somewhat improved 6 7 Almost safe 0 0 Unchanged 2 2 Some problem 1 0 Exacerbated 2 0 Problem 1 0 Signifi cance test Not signifi cant Signifi cance test Not signifi cant Values represent the number of subjects.
Purchased for the exclusive use of nofirst nolast (unknown)
From: SCC Media Library & Resource Center (library.scconline.org)