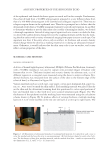
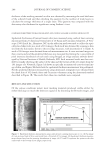
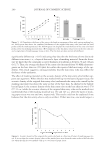
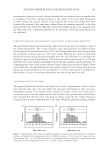
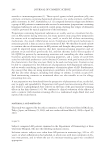
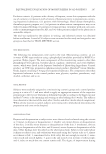
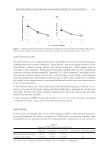
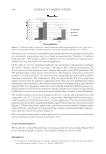
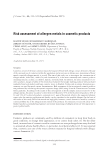
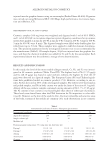
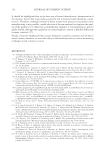
ACOUSTIC PROPERTIES OF THE SKIN ENTRY ECHO 287 of the epidermal and dermal thickness appear to match well in this example. Furthermore, this echorich band from a 50-MHz ultrasonogram appeared in a very different shape from that of a 100-MHz ultrasonogram in El Gammal and colleagues’ report (10). There was no echopoor region shown in the epidermal area. These facts prompted us to believe that the ultrasound results from a 50-MHz sonogram warranted a specifi c investigation. In an effort to determine whether or not the skin entry echo is solely a meaningless artifact, we devised a thorough experiment. Instead of using topical agents such as a cream to occlude the skin, we altered the sudden density change between the coupling medium and the skin by mask- ing the skin surface with a variety of materials ranging from paper tissue to scotch tape. Our argument was that, if the entry echo is only an artifact, its thickness and acoustic density should change when the skin has a masking material on it during an ultrasound measure- ment. Otherwise, it would indicate that the skin entry echo is not an artifact, and it may refl ect certain properties of the skin. MATERIALS AND METHODS MASKING EXPERIMENTS A device of dermal high-frequency ultrasound, DUBplus (Taberna Pro Medicum, Germany) with a 50-MHz transducer, was used to capture cross-sectional images of human volar forearm skin in vivo. Thickness (in μm) and acoustic density (in arbitrary unit, a.u.) of different regions in a sonogram were measured using the device’s analysis software. Epi- dermal thickness was measured from the surface of the skin to the bottom edge of the echorich band, as illustrated in Figure 1B. Various materials such as scotch tape, copy paper, cotton pad, aluminum foil, paper tis- sue, etc., were tested to mask the skin surface. Each masking material was placed directly on the skin and the ultrasound scanning head was positioned to cover equal portions of bare and masked skin so that both sites were scanned simultaneously (Figure 2A). The thicknesses of the epidermis and the masking layer were measured using the calculation scheme shown in Figure 2B. To produce effects of varying thickness, multiple masking layers (2 × 2 cm2) were laid fl at on the test site one layer at a time up to eight layers. The Figure 2. (A) Illustration of ultrasound transducer (scanning head) position. It is placed in such a way to cover the masked and the bare skin sites in one measurement. (B) Calculation scheme for entry echo thick- ness. The thicknesses of bare skin, masking material, and the masked skin (skin + mask) are represented by the dimensions of X, Y, and T (= X + Y), respectively.

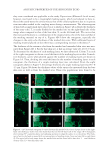
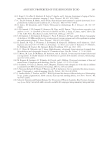
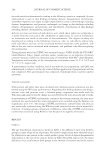
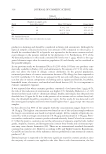
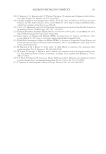
JOURNAL OF COSMETIC SCIENCE 288 thickness of the masking material on skin was obtained by measuring the total thickness of the echorich band and then dividing the quantity by the number of mask layers to calculate the average thickness of a single layer. This quantity was compared with the skin entry echo thickness for signifi cance using Student’s t test. COMPARISON BETWEEN ULTRASONOGRAPHY AND CONFOCAL LASER SCANNING MICROSCOPY Epidermal thicknesses of human forearm skin were measured using confocal laser scanning microscope from 25 dorsal and ventral sites of 10 Asian and Caucasian volunteers. A Viva- scope 1500 (Lucid Inc., Henrietta, NY) in the refl ection mode was used to collect the opti- cally sliced skin views in a stack of 164 images. Each stack was obtained by scanning a skin site from the skin surface down to the rete ridge structure, with increments of 1.52 μm. A stack of 164 images were obtained from each measurement site. A cross-sectional image was then constructed and the epidermal thickness was measured by plotting the z-axis profi le of pixel intensity distribution of each stack using ImageJ, an image analysis software devel- oped by National Institute of Health, Bethesda, MD. Each measured result was then veri- fi ed by visually observing the surface of the skin and the bottom of the rete ridges from the 164 images of a Vivastack. Figure 3A shows an optically reconstructed cross-sectional im- age of skin, and Figure 3B shows how the epidermal thickness measurement was performed. For the epidermal thickness measurement using ultrasound, sonograms were obtained from the cheek skin of 102 female Asian and Caucasian volunteers using the ultrasound method described in Figure 1B. The results from these two methods were compared. RESULTS AND DISCUSSION Of the various conditions tested, most masking materials produced visible artifact by either blocking too much the detection signal or by distorting the B-mode images, and Figure 3. Epidermal thickness measurement using confocal laser scanning microscope in vivo. (A) An image of cross-sectional view of skin constructed from a Vivastack of 164 images. (B) Epidermal thickness measure- ment scheme based on the intensity distribution of image (A). P1 and P2 represent the points at the skin surface and at the bottom of rete ridges, respectively.
Purchased for the exclusive use of nofirst nolast (unknown)
From: SCC Media Library & Resource Center (library.scconline.org)