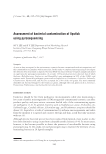
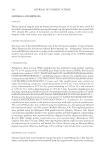
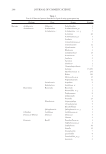
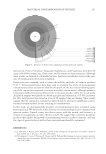
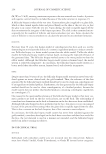
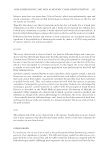
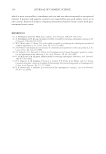
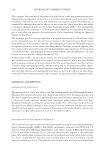
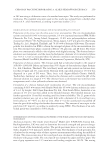
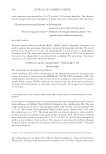
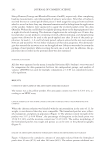
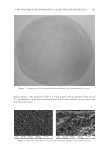
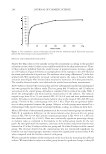
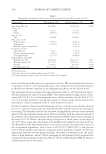
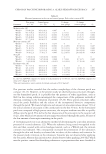
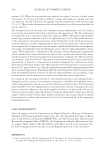
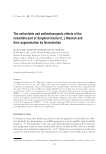
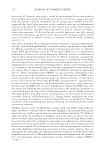
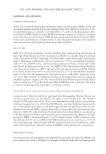
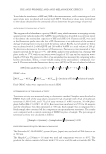
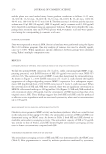
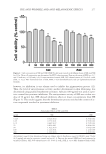
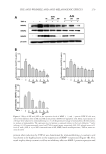
CHITOSAN PATCH INCORPORATING A. ALTILIS HEARTWOOD EXTRACT 263 distinct phases a the rapid rate in the 0–15 min period, with an average release rate of 0.73 μg/min/mm2, and a slow rate from 15 min to 240 min, with the average release rate of 0.02 μg/min/mm2. Figure 1. An appearance of the formulated chitosan hydrogel patch incorporating the extract. Figure 2. Top surface (left) and cross-section (right) photomicrographs of the formulated patch.

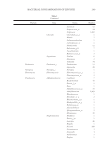
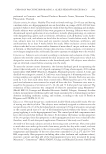
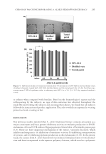
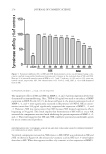
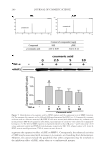
JOURNAL OF COSMETIC SCIENCE 264 EFFICACY AND TOLERANCE EVALUATION Ninety-fi ve Thai subjects were initially screened for recruitment according to the specifi ed inclusion criteria, with 62 subjects successfully enrolled for the skin irritation test. Three of these subjects withdrew from the study because of personal reasons, leaving a sample set of 59 subjects. Figure 4A shows an example photo of the response to the 20% SLS and the tested patch after the 4-h patch test. The erythema value (using a Mexameter®) of the skin applied with SLS signifi cantly increased compared against the value at baseline (before irritation test) (Figure 4B). Irritated skin returned to normal at 24 h after pad removal. The visually observed results coincided with the results from erythema measurement. All 59 subjects tolerated the tested patches and were subsequently enrolled and randomized into two groups for the effi cacy study. The test group had 30 subjects, and 29 subjects were placed in the control group. All subjects completed the 8 weeks of the study. Table I shows the demographic and mean baseline characteristics of the subjects. The subjects ranged in age from 24 to 51 year (mean ± SD, 42.2 ± 6.0 year) and were predominantly female. All subjects in both groups had a melanin value in the range of 290–490 AU (test group, 370.8 ± 2.8 AU control group, 369.1 ± 4.1 AU). There was no signifi cant differ- ence in skin properties between the groups. Subjects in both groups were assessed by a dermatologist who reported none as having erythema, scaling, or oedema on their faces. Mean ± SD values of the measured parameters in the test and control groups are shown in Table II. A signifi cant difference in the mean melanin value between the test group (mean ± SD, 346.4 ± 4.4 AU) and the control group (mean ± SD, 364.5 ± 5.1 AU) was fi rst observed at week 3 ( p 0.001). There was a statistically signifi cant percentage change in melanin value as compared to the baseline in the within-group results for the test patch. By the eighth week of treatment, a decrease in the melanin value from baseline was observed in 27 of the 30 subjects of the test group and 12 of the 20 subjects of the control group. The decrease observed in the control group was not statistically signifi cant. In both the test and control groups, moisture content was signifi cantly increased after 8 wk when compared with the baseline values of each group. We also assessed the mildness of the tested patch on the facial skin by measuring skin pH and redness. We found that no subject in either group showed a signifi cant change in skin pH Figure 3 . The cumulative content of artocarpin released from the formulated patch. Each point represents mean ± SD of percentage of artocarpin released (n = 3).
Purchased for the exclusive use of nofirst nolast (unknown)
From: SCC Media Library & Resource Center (library.scconline.org)