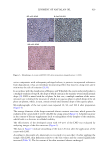
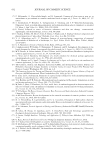
602 JOURNAL OF COSMETIC SCIENCE cysteic acid level on the first few microns of the hair surface. Approximately 30–50 fibers per panelist were bundled and measured at different locations from root to tip. Each measurement was conducted with eight scans from 600–4,000 cm-1 and 4 cm-1 resolutions. Due to the specificity of cysteic acid peaks, ATR-FTIR has been used as an industrial method for assessing the level of chemical damage present on hair surface. In the conventional method (6), the second derivative of the cysteic acid peak at 1,040 cm-1 (normalized to the 1,450 cm-1 protein CH 2 stretch peak) was taken as the relative chemical damage on clean hair. Silicone is commonly used in most hair care products and can easily be deposited on human hair. The cysteic acid and silicone peaks appear at the same region (1,000–1,250 cm-1) and may interfere with one another. Chemometric approaches are used to measure cysteic acid level in the presence of silicone. The classical least square method was the first used to estimate silicone in hair, based on pure component spectrums that can be measured separately (i.e., silicone, hair keratin, and cysteic acid). Then the silicone value, together with hair spectrums (700–1,800 cm-1) at different damage levels with corresponding mass spectrometry data (the range was normalized from 0 to 1), were used as a calibration data set to build a partial least square (PLS) model using PLS Toolbox 8.61 (Eigenvector Research Inc., Wenatche, WA, USA). The spectrum preprocessing and analysis was done in MATLAB 2018b environment. The root means square error cross validation of the PLS model for both cysteic acid and silicone are 0.0068 and 0.00134 with R2 values of 0.99 and 0.97, respectively. FATIGUE MEASUREMENTS Fibers were cut for fatigue strength measurements from the root and tip end of the panelist samples (7–10 cm long) and crimped at 30 mm using a Dia-Stron Auto-Assembly System (AAS 1600) (Andover, Hampshire, UK). The average cross-sectional area along each fiber was analyzed using a Dia-Stron Fiber Dimensional Analysis System (FDAS 770), which incorporates a Mitutoyo laser micrometer (LSM-6200) (Malborough, MA, USA). The average cross-sectional area was calculated from three diameter measurement points along each 30 mm crimped fiber. The average cross-sectional values for each of the fibers were then used to set the Dia-Stron Cyclic Tester (CYC801) in controlled stress mode. Stress was 140 MPa with a speed 40 mm/s. Data were analyzed by Weibull statistical tools (JMP Pro 12.1.0, SAS Cary, NC). Fit with the Weibull distribution was confirmed for each data set. Fibers with break cycles less than 10 were omitted from the analysis due to premature breakage and were mostly between 2–4 fibers. Fifty fibers per sample were measured and all measurements were made at a relative humidity of 50% and temperature of 23°C. CUTICLE MEASUREMENTS For the Caucasian panelists, 25 fibers from either the hair mids or tips (less than 5 cm from the fiber distal end) were mounted for scanning electron microscopy (SEM) analysis. Each fiber was graded at 750× magnification according to the scale on a Hitachi S-3000N (Krefeld, Germany). Low damage: cuticle aligned and spaced regularly but some irregularity or slight lifting of the cuticle is observed (up to ∼15% lifting). Mid damage: cuticle is irregularly spaced due to missing cuticle edges, but all cuticle is present tightly packed cuticle with lifted cuticle

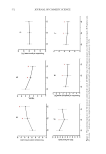
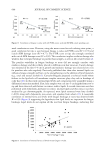
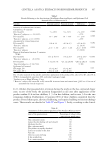
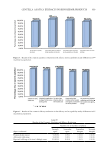
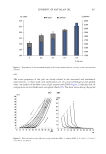
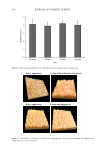
603 FATIGUE STRENGTH OF PANELIST HAIR edges. High damage: any cuticle missing up to 50% of fiber significant cuticle chipping and partial removal of cuticles. Stripped: majority of fiber stripped (must be 50%). Hair Damage Severity Scale (HDSS) was calculated from this assessment: HDSS = (1× low) + (3× medium) + (5× high) + (7× stripped)*(100/175). LIPID MEASUREMENTS For each sample of Caucasian panelist samples ∼0.1 g of hair was cut into 20–40 mm segments and placed in vials (n = 4). First, the hair was extracted gently with hexane to remove the external cetyl and stearyl alcohol and lipids. The hexane extraction consists of extracting the hair with hexane two times then concentrating the dried residue in a second solvent and BSTFA derivatizing reagent for the gas chromatography. Next the internal cetyl and stearyl alcohol and readily extracted internal lipids were extracted using 2:1 then 1:1 chloroform–methanol. The chloroform contained 10 mM dimethylhexylamine (DMHA) and the methanol 1% formic acid. Each extraction was heated for 30 min at 65°C with the hair, then combined, and the dried residue derivatized with BSTFA + 1% TMCS. Cetyl and stearyl alcohol and internal lipids were quantified by gas chromatography (GC) with flame ionization detection using a polydimethylsiloxane capillary column with hydrogen mobile phase. Nonadecanoic acid and eicosanoic acid were used as internal standards. For the sebum, an artificial sebum formula was used containing a mixture of fatty acid, squalene, cholesterol, waxes, and triglycerides. RESULTS CAUCASIAN PANELIST RESULTS The Caucasian panelist hair samples were all between 30 and 45 cm long and were either straight or very slightly wavy (curl pattern I or II according to the L’Oreal curl scale) (7). A 10 cm section was cut at the root and tip end for a total of 50 fibers for fatigue testing. Figure 1 shows the α-value for each panelist’s root and tip samples calculated from the survivial probability after confirming the data fit a Weibull distribution. This α-value is the number of cycles for 63.2% of fibers to break and was found to highly correlate with median cycles to break (0.96 correlation for root and 0.88 for tip across all the samples). The data show high variability between samples, especially for root samples with a maximum α-value for panelist 2,078 of 36,228 cycles and a minimum α-value for panelist 2,147 of 1,726 cycles. The root samples were exposed to some coloring and physical damage but this does not explain this wide variability. Although not studied in this work, protein content or other factors can also impact this difference however, this work does show a correlation of α-value with internal lipids. The average root α-value across all panelists was 6,276 versus 4,536 for tips, showing an overall decrease in fatigue strength as hair became damaged. About 30% of panelists showed a decrease in fatigue of more than 3,000 which was driven in part by oxidative treatments (i.e., hair coloring). About 40% of panelists showed a minor increase or decrease in α-value. Figure 2 shows each panelist’s β-value for root to tip. A decrease in β-value was measured for 80% of panelists and the average dropped from 1.03 to 0.748. The β-value describes the shape of the Weibull distribution and a lower number indicated increased premature
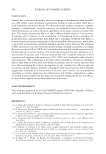
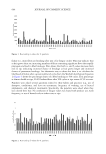
Purchased for the exclusive use of nofirst nolast (unknown)
From: SCC Media Library & Resource Center (library.scconline.org)