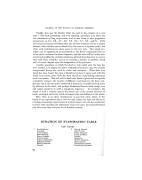
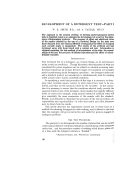
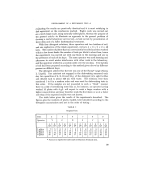
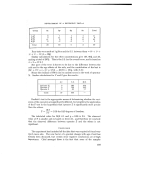
DEVELOPMENT OF A DETERGENT TEST--I or whatever variances are being tested) and compare it with the variance of the remainder, using the F test, and rejecting the null hypothesis at a signifi- cance level in one in 40N. This corresponds roughly with Bartlett's test at a 1 per cent significance level. A test of the above data for homogenity of the overall variance just fails to reach the rejection level on either the F test or Bartlett's test. The margin, however, is small and it is possible that, even if the overall variance is not really heterogeneous, one of the components of the variance may be so. The graph of overall standard error against mean results is roughly a straight line through the origin (being practically identical with that found by Pugh' and confirmed by many other experiments) which indicates that the error is proportional to the result. Transforming the data to a logarithmical form will, therefore, produce much more homogeneity of variance. ' Hence we now draw up a table of data in the same f6rm as Table I, but expressing the results as logarithms of the numbers of plates. To simplify the arithmetic, we next "code" the results by deducting a c6nstant and multiplying by 100. As we are not at present interested in comparisons between concentrations, we use different constants for the four samples, and take these near to the true means in order that the transformed figures will' be numerically small. The constants deducted are given in the seconc[ column of Table III. As an example, the results of Table I for 4 g/litre are given below, and the successive stages of the calculation are indicated. TABLE Date 2 3 6 7 8 9 Operator Y Z X Z Y X '1 Soil a p a p a p a p a p a p Q2 Q3 Q3 Q2 Q2 Q3 Q2 Q3 Q3 Q2 Q3 Q2 ,. Plates 16 14 14 14 18 16 13 15 12 12 14 16 Logarithm 1.20 1.15 1.15 1.15 1-26 1.20 1.11 1.18 1.08 1.08 1.15 1-20 Deduct 1.15 .05 .00 .00 .00 .11 .05 -.04 -03 -.07 -'07 '00 '05 X100 5 0 0 0 11 5 -4 3 07 -7 0 5 ,, The transformed results of the last row are then re-tabulated under main headings of soil and operator to give, with the other concentrations, the data of Table III. lol

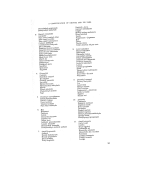
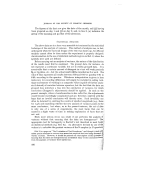
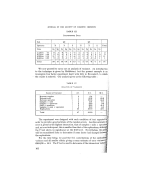
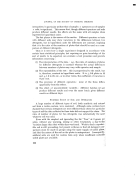
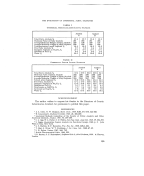
JOURNAL OF THE SOCIETY OF COSMETIC CHEMISTS TABLE III TRANSFORMED DATA Soil •2 Operator X ¾ Z X Z Total , Date 6a 9p 2a 8p 3p 7a 6p 9a 2p 8a 3a 7p 1 g/litre .77 8 1 8 -7 t -7 1 1 -7 1 1 1 2 2g/litre 1.00 0 11 0 0 4 -5 -5 0 -5 0 0 0 0 4 g/litre 1.15 11 5 5 -7 0 -4 5 0 0 -7 0 3 11 6 g/litre 1.25 5 -2 5 -2 1 3 -2 1 -5 -2 -2 1 1 Total 24 15 18 -16 I 6 -13 -1 2 -17 -8 -1 5 14 We now proceed to carry out an analysis of variance. An introduction to the technique is given by Middleton', but the present example is an incomplete four factor experiment dealt with fully in Brownlee4b, to which the reader is referred. Our analysis gives us the following table ß . : TABLE IV '• :'•.• ANALYSIS OF VARIANCE , Source of Variance d.f. S.S. M.S. -- Between samples 3 6-4 Between soils 1 60.8 60.8 Between operators 2 129. $ 64.8 Samples X soils 3 12.4 4.1 Samples x operators 6 54'0 9.0 'Soils X operators 2 82-6 41.3 Samples x soils X operators 6 39-2 6.5 Replications 24 531.0 23.1 Total 47 915.9 The experiment was designed with each condition of test reveated ifi•:j• order to provide a good estimate of the random errors. Another e•timate error is given by the highest interaction, that of samples x soils x operat )peratoL•!• and, as is not infrequent, this is smaller than that of the replications, altho the F test shows no significance at the 0.05 level. Nevertheless, the pu will be reconsidered later to determine if some factor had changed the replications. For the time being, we pool the S.S. contributions of the replica• variance and aH smaller effects giving a mean estimate of error 636.6/39 = 16.3. The F test is used to determine if the interaction vari a•i•
Purchased for the exclusive use of nofirst nolast (unknown)
From: SCC Media Library & Resource Center (library.scconline.org)