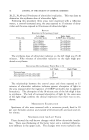
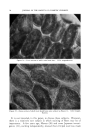
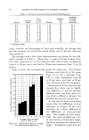
PHOTOMICROGRAPHIC TECHNIQUES FOR HAIR 97 up of two rather differently constituted hemicylinders, the positions of which are exactly related to the curve of the crimp wave. There are a number of ways of showing this, as a previous seminar of this SOCIETY has already heard (12). The dye-accessible portion has been designated as the orthocortex the nondye-accessible portion, the paracortex. Du- senbury and Jeffries (12) presented some evidence that human hair was essentially paracortex, but their investigation did not go into the question of whether curly and kinked human hair had any bilateral character, or whether chemical treatments had any effect on the hair that could be observed in this fashion. These are subjects worthy of further study. PHOTOMICROGRAPHY IN THE STUDY OF PERMANENT WAVING "PROBLEMS" Having described some of the photomicrographic methods that are particularly suited to the study of hair, their utility will now be illustrated by the following brief description of part of an investigation carried out in connection with permanent waving. It is well known that some hair, for reasons that are not always obvious, is more difficult to wave than usual. It has often been said that this occurs more frequently with chil- dren's hair than with adult hair. The purpose of the investigation was to see if any physical characteristics of the hair could be correlated with the waving problems. A group of ten children (ages 4i/2 to 12) and a group of ten adults (ages 15 and over) were used. On the basis of past permanent waving history, these were selected to have a higher incidence of "problems" than the usual cross section of the population. The existence of "problems" was confirmed by giving waves in the experimental beauty shop and by laboratory waving studies of samples of the hair. From these results, six of the individuals were classified as "problem heads." In addition to measuring diameters, Trotter Indexes, cross-sectional TABLE 1--AVERAGE CHARACTERISTICS OF CHILDREN'S HAIR SAMPLES Sample Load, gm., Area Medulla- per Hair Trotter X l0 t, don, at 20% Index sq. in. Density % Extension C-1 64.8 5.04 1.10 45 C-2' 77.2 5.11 1.19 30 1•' 8 C-3' 90.6 5.96 1.17 50 17.8 C-4 80.0 5.39 1.23 50 17.2 C-5 74.7 5.07 1.22 30 16.2 C-6 72.2 4.80 1.23 40 15.3 C-7' 85.6 5.13 1.20 10 C-8' 66.0 5.94 1.13 0 c-9' 75.2 4.70 1.15 15 C-10 63.6 6.60 1.09 20 * "Problem" hair.

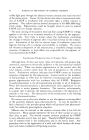
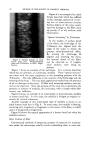
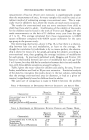
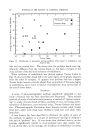
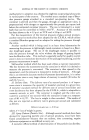
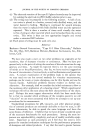
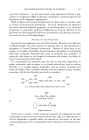
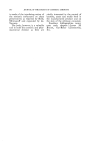
98 JOURNAL OF THE SOCIETY OF COSMETIC CHEMISTS TABLE 2--AVERAGE CHARACTERISTICS Or ADULT HAIR SAMPLES Sample Load, gm., Area Medulla- per Hair Trotter X 1.06, tion, at 20% Index sq. In. Density % Extension A-1 72.0 9.51 1.13 85 31.4 A-2 70.9 6.63 1.18 40 23.1 A-3 67.4 6.78 1.22 45 24.2 A-4 72.2 5.56 1.26 45 21.2 A-5 64.7 9.52 1.14 65 23.9 A-6* 70.0 5.73 1.07 10 14.3 A-7 76.3 8.22 1.19 70 26.1 A-8 68.5 6.55 1.18 30 21.3 A-9 66.4 5.99 1.10 45 17.9 A-10 62.4 12.72 1.10 95 35.8 * "Problem" Hair. areas, densities and percentages of hairs with medullas, the average load per hair necessary to stretch the sample 20 per cent in the wet state was also measured. The average results from these determinations are shown for the chil- dren's samples in Table 1. These show a range of Trotter Indexes from 63 to 90 areas from 4.7 to 6.6 densities from 1.09 to 1.23 medullation from 0 to 50 per cent and load at 20 per cent extension from 15 to 18 grams. Table 2 shows the corresponding results for adult hair. The Trotter Indexes vary from 62 to 76 areas 100 =• 90 • 80 5 70 •. 60 • 50 • 40 • 30 •0 20 4 •0 0 3 4 5 6 7 8 9 1011 12 13 Average Cross-Sectional Area X 10 6 (sq. in.) Figure 18. Relationship between medulla- tion and cross-sectional area. from 5.5 to 12.7 densities from 1.07 to 1.26 medullation from 10 to 95 per cent and load at 20 per cent extension from 14 to 36 grams. Examination of the data quickly showed that there was no signifi- cant difference in density between children's hair and adult hair, nor was there a difference between the problem hair and the normal hair. It can also be shown from these results that the differences in load necessary to achieve 20 per cent extension are a direct reflection of the differences in cross-sectional area. The samples all have essen- tially the same strength per unit of cross section if the area is larger, the force necessary for extension is larger. It might be noted that the
Purchased for the exclusive use of nofirst nolast (unknown)
From: SCC Media Library & Resource Center (library.scconline.org)