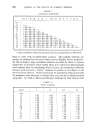
THE RHEOLOGY OF PASTES, SUSPENSIONS AND EMULSIONS 187 "hesion balance" since some complex function of adhesion and cohesion is being measured.* Stickiness may also be measured in terms of the angie of repose of a cylinder resting on a flat surface which is tilted at a steady rate until the component of gravity force becomes just great enough to cause a movement. Claassens has shown that, in the case of butter, the order of stickiness for a given butter against a wide variety of adherends is almost exactly the opposite when determined by the desion balance and by the angle of repose methods. The tests we have discussed so far, all attempt to measure some kind of physical property having definite dimensions, even if the magnitude of the property is considerably dependent on the exact way in which it is measured. Even so complex a property as hesion between two mateddais is expressed as a force per unit (nominal) area. But in many industrial laboratories, tests are done as a routine which are purely imitative, either of processes to which the materials will be subjected in manufacture or in use, or of the processes of handling (squeezing, thumbing, etc.) by which their quality is normally assessed by experts. Such data are of undoubted practical use, even though they measure very complex modes of behaviour and may overlap one another in what they do, in fact, determine. A first step in co!!ating information from batteries of such tests, both objective (instrumental) and as subjective scorings, is to construct a matrix of correlation coefficients between each and all of them. One of the objec- tions to the use of correlation coefficients is that it assumes linear relations between the tests. In a few cases, where it is very clear that this assumption is far from justified, linearization can be improved by using some simple function, say, a power or a logarithm, of the experimental data. But the device is of limited value. There are other objections to the use of correlation coefficients. For example, a rank order scale, say a five-point scale such as "very firm, firm, medium, soft, very soft", is what Stevens • has called an ordinal scale, i.e. no equality of intervals between the categories is claimed. Such scales should not, strictly, be treated by any but the simplest statistical processes. But Stevens admits that more complex statistical treatments often appear to justify themselves pragmatically. Certainly, correlation matrices are useful. An example is given in Table 1, by Baron and Harper •3, who correlated 14 tests, of which 6 were subjective scorings of various qualities of a large batch of commercial cheese. A nega- tive sign simply means that, to obtain positive correlations, "firmness", for example, must be converted into "softness". Such tables are still cumbersome and it is tempting to try to submit * Compare the use of "sorption" for ill-defined combinations of absorption and adsorption.

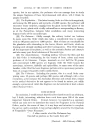
188 JOURNAL OF THE SOCIETY OF COSMETIC CHEMISTS TABLE 1 Correlation Coefficients* Test A--B--D E G I --K --L M N 0 P Q R Jest A -- --B + .75 -- --D +-54 +.66 -- E +.79+.47+.38 -- G +-47--.05+.01 +.71 -- I +.75+.66+.51+.69+.38 -- --K +.52+.38+-38+.58+.39+.60 -- --L +.49+.44+.09+.30+.12+.32+.22 -- M +.76+.56+.47+.69+.46+.66+-68+.26 -- N +.70+.59+.42+.62+.37+.61+.52+.31+.79 -- O +.65+.34+-25+.70+.65+.53+.62+.33+.70+.53 -- P +.53+.29+.12+.50+.52+.38+.34+.38+.50+.43+.72 -- Q +.08--.39-.29+.32+.68--.01 +.08--.07+.18+.05 +.39+.30 -- R +.35+.09+.05+.53+.61+.26+.21+.11+.38+.29+.56+.49+.55 -- * These correlation coefficients are based upon the measurements on 200 cheese. them to some form of multivariate analysis. All available methods are subject to criticism but the most widely used is Multiple Factor Analysis TM. By this technique, large correlation matrices can often be shown to possess regularities of structure which enable them to be reduced to dimensionally much simpler form, by calculating what is, in fact, the correlation coefficient between each test and a "factor" common, in greater or less degree, to all the tests in the battery. These factors may be regarded as being measurable by imaginary tests and may, in trivial cases, turn out to be simple physical properties. In Table 2, Baron and Harper's loadings for their tests on four TABLE 2 Factor Loadings _Factor I II III IV Test G +-67 +.60 + .23 -- .10 Q +.27 +.75 +.15 -.03 E +.88 +-09 + .16 --.21 R +.55 +.51 --.06 --.15 O + .84 +.25 --.10 +.25 P +.67 + .24 ---34 +.19 -- K +.66 --.14 +.25 +-26 M +-86 --. 18 + .21 +.22 N + .74 --.25 +.12 +.12 I +.76 --.31 +.12 --.11 --D +.44 --.51 +.11 ---20 A + .90 --.26 --.10 -- .17 -- B + .62 -- .68 -- .28 -- -21 --L +.39 --.15 --.40 +.09
Purchased for the exclusive use of nofirst nolast (unknown)
From: SCC Media Library & Resource Center (library.scconline.org)