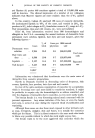
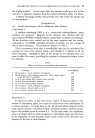
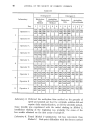
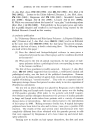
40 JOURNAL OF THE SOCIETY OF COSMETIC CHEMISTS Table III Detergent B Detergent C Laboratory Methylene ptoluidine blue hydrochloride Methylene ptoluidine Method Method blue hydrochloride Day 1 2 3 1 2 3 1 2 3 1 2 3 437 434 438 412 411 415 487 483 486 459 459 464 Operator A 437 434 438 410 413 419 485 483 486 549 461 466 437 436 436 487 483 488 1 430 430 430 417 430 420 480 482 480 470 472 385 Operator B 430 430 430 419 426 420 480 482 480 470 472 381 430 430 430 480 482 480 426 426 426 435 425 425 480 480 480 476 479 476 Operator A 426 426 426 437 425 425 480 480 480 476 476 476 426 426 426 484 480 480 2 430 428 428 426 425 424 482 480 480 473 472 479 Operator B 434 432 430 424 425 427 480 480 480 473 476 484 432 432 430 480 480 480 410 402 419 376 420 412 468 458 465 460 474 460 Operator A 419 400 414 386 418 413 467 457 469 459 472 461 414 404 412 466 457 467 3 399 405 420 405 414 422 465 459 461 472 469 465 Operator B 410 408 421 403 414 420 456 459 469 471 470 467 400 403 425 457 454 472 438 432 426 410 407 405 488 478 488 457 454 456 Operator A 436 432 426 409 406 406 488 479 489 456 454 454 437 432 427 486 478 486 4 452 449 443 425 426 425 499 495 491 460 460 465 Operator B 451 448 443 423 423 425 499 496 492 456 463 465 449 449 445 500 495 493 453 446 449 410 423 419i506 506 502 461 473 461 5 Operator A 452 446 448 410 413 418 506 505 501 461 463 465 452 446 449 505 505 499 Laboratory 3. Preferred the methylene blue method on the grounds of speed and pointed out that the cetrimide solution did not require daily standardization, as did the alcoholic potash. Some trouble was experienced with the initial shaking in Method 2, insufficient shaking at the beginning was probably the cause of the low results obtained on the first assay of sample B. Laboratory 4. Found Method 2 satisfactory, but less convenient than Method 1. End-point difficulties with the former method

PRELIMINARY NOTES ON THE DETERMINATION OF ANIONIC SULPHATES 41 were resolved by increasing the amount of indicator solution to 1 ml. Laboratory $. Drew attention to the importance of shaking vigorously for the required time in Method 2. The end-point drift was also noted by this laboratory. In making comparisons of analytical methods it is essentiM that these should be based on a series of statistically uniform determinations, i.e. a series of results from independent repetitions which are uncorrelated and which vary randomly within constant limits. The ease or difficulty of maintaining different methods in such a statistically uniform state will be as important a consideration as their difference in precision. This can only be assessed when a run of 20 or more determinations has been obtained with each method and implies routine use of the methods. In carrying out an investigation of this sort, involving repetitions of a routine nature, a graphical assessment of the precision of the different methods is useful and provides a valuable stimulus to the staff concerned. Relative Accuracy In considering the relati ½e accuracy of analyses from different labora- tories and analysts, the data from laboratory No. 3 was not included since their results were of a lower precision than from other laboratories. Further, although two analysts reported determinations from laboratory No. 3 these were not independent, being based on titrations of aliquots from the same solutions of detergent samples. The following conclusions were reached: (a) There was a difference between analysts in the same laboratory in the relative accuracy of the two methods. (b) There was a difference between the two analysts in laboratory 5 in the relative accuracy for determinations on the same sample. This was not found in laboratories 1 and 2. Analysis of this data has been carried out to estimate and compare the precision and relative accuracy of the two methods. In order to identify particular factors concerned in their precision and accuracy it was assumed that the individual results could be represented as a combination of the effects of these factors and a random "error" variation. Estimates of this "error" variation were obtained for each laboratory and compared to determine whether analyses from the same laboratory were comparable in precision and whether this precision varied between laboratories. Data from three of the laboratories was then analyzed to compare the effects of different factors on the relative accuracy of the analyses.
Purchased for the exclusive use of nofirst nolast (unknown)
From: SCC Media Library & Resource Center (library.scconline.org)