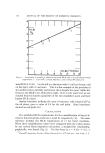
JOURNAL OF THE SOCIETY OF COSMETIC CHEMISTS really different, or whether repetition of the experiment would be likely to show no difference at all, or even a reversal of the original magnitudes. For example, one may have two sets of viscosity measurements, one for an old lotion formula and one for a new composition. The data may sug- gest that the new formula has a lower viscosity than the old one. The difference between the two averages may be so large as to produce great conviction that it is real rather than the result of sampling or testing variation on the other hand, the difference may be small, and may leave doubt in the investigator's mind. Even in the first case, however, it may be that an objective way of verifying the apparent difference would be more convincing to the investigator himself or to others than a simple presentation of the results supported by a professional opinion. If this is the case, these tests should be found useful and interesting. The use of statistics is not necessary to conduct investigative tech- nical or scientific work. Obviously, many great discoveries have been made without the benefit of a knowledge of such procedures. These tools are now available, however, and provide valuable supplements to professional experience and skill. In addition, in many cases they will allow a reduction in the amount of routine work necessary to arrive at a decisive conclusion, and they always provide a more objective basis for a statement of opinion. The experimenter unfamiliar with statistical procedures should follow the directions given here and in the references quite literally. It is possible to break the rules, but statistics is full of traps for the unwary. On the other hand, application of the tests as described is not difficult, and is unlikely to lead to serious misunderstanding of the results. Much of the content of this presentation is very detailed, elementary and "cookbook" statistics. If the reader is already well-versed in the application of statistical methods and experimental designs to investiga- tive work, this presentation will probably represent familiar material. It has been the writer's experience, however, that most statistical litera- ture is so surrounded by mathematical abstractions, and appears so rarely outside of the statistical journals and texts, that many if not a majority of workers in an applied field may have become reluctant to try them. WILCOXON Two-SAMPLE RANK SUM TEST This test is intended for use in comparing two independent sets of data to determine the probability that their average values would be the same in the long run, if the experiments were repeated an indefinite

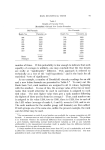
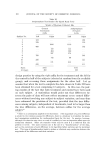
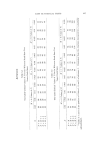
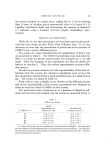
EASY STATISTICAL TESTS Table I Results of Viscosity Tests (Brookfield) Old and New Lotion Formulas 97 Old Formula New Formula Batch No. Viscosity, cp Batch No. Viscosity, cp 364 1558 723 1560 382 1600 740 1423 401 1423 796 1300 465 1842 843 1600 489 1761 975 1329 503 1602 989 1590 510 1657 994 1423 999 1298 Sums 11443 11523 Averages 1635 1440 number of times. If this probability is low enough to indicate that such equality of averages is unlikely, one may conclude that the two means are really or "significantly" different. This approach is referred to technically as a test of the "null hypothesis," and is the basis for all statistical "tests of significance." As an example, a number of Brookfield viscosity readings for an old and a new lotion formula are presented in Table I.* To carry out the Rank Sum Test, rank numbers are assigned to all 15 values, beginning with the smallest. In case of ties, the average value of the two or more ranks that would otherwise be used in succession is assigned to each tied value. The next higher value then gets a rank number following the highest of those used to form the average. t Thus, rank number one is assigned to the value 1298, two to 1300, three to 1329, five to each of the 1423 values (average of ranks 4, 5 and 6), seven to 1558, and so on. The rank numbers for the smaller group (old formula) are then added. If both groups are of the same size, unlike the present example, the rank sum for either may be used. * One measurement on each of seven batches was available for a group comprising an old formula. A measurement on each of eight was obtained for a new for•nula. The problem is to determine whether the numerical difference from measurement to measurement for a given formula, representing normal batch-to-batch variation as well as any variation attributable to the measurement procedure itself, is smaller than the difference between the averages of the two sets of measurements. t A large number of ties among the data (more than 10% or so) is undesirable, as it tends to affect the correctness of the probability value obtained at the end of the test. The true probability in such a case will be smaller than that found.
Purchased for the exclusive use of nofirst nolast (unknown)
From: SCC Media Library & Resource Center (library.scconline.org)