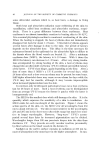
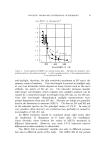
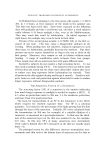
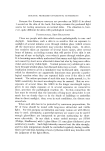
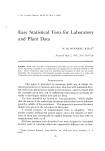
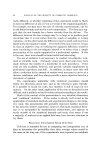
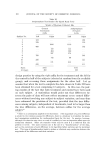
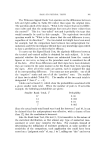
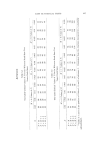
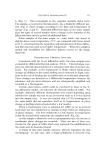
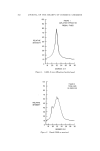
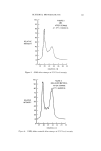
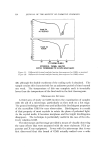
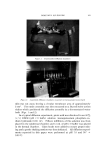
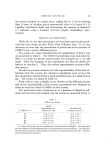
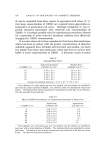
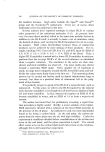
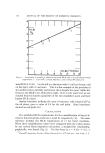
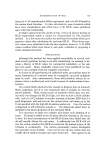
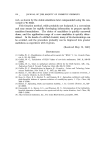
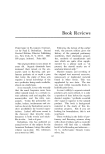
GLYCERYL MONOSTEARATE 111 A (Fig. 1). This corresponds to the reported unstable alpha form. The sample, as received in this laboratory, has a distinctly different pat- tern (Fig. 2) which changes according to the time and temperature of storage (Fig. 3 and 4). Repeated diffraction data on the same sample after the lapse of several months show a change in the intensity of the diffraction lines and the growth of additional lines. When samples of the same origin, i.e., same batch, but stored at slightly above room temperature, 37 øC, are compared with those stored at 21 øC, it is found that the separation and enhancement of these diffrac- tion lines has increased at the higher temperature. When the sample is melted and resolidified the diffraction pattern reverts to the single, sharp line. DIFFERENTIAL THERMAL ANALYSIS Concurrent with the X-ray diffraction work, the same samples were evaluated by differential thermal analysis (DTA). This technique com- pares the thermal characteristics of a substance with that of an inert ma- terial. For example, as the temperature is slowly raised, subtle phase changes in addition to the actual melting can be detected as slight varia- tions in the rate of heating due to endothermic or exothermic properties. These changes are detected as a differential temperature between the substance and the inert reference and are subsequently amplified and recorded as a thermogram. Certain observations, which could be correlated to those of the X- ray diffraction studies, are noted for the thermal studies of GMS. For example, distinctly different thermograms were found depending upon whether the sample was run on an as-received basis or if it was melted into the sample tube. It was also learned that a DTA thermogram of the same batch did not reproduce itself as to temperatures of phase change or melting when rechecked after a few months. When a thermogram trace is obtained for GMS on an as-received basis there are two endotherms or changes in slope which are indications of phase changes. The first endotherm is a few degrees in temperature below the second which represents the complete melt (Fig. 5A). As this sample is allowed to cool at a programmed rate, the inverse or exothermic phase changes are recorded. There are two of these exo- therms for this grade of GMS which may represent the solidification of the mono and di stearates present. A reheat of this same sample, however, will not reproduce the first thermogram. In this case, only a single endotherm is detected (Fig.

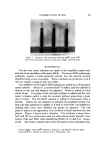
112 JOURNAL OF THE SOCIETY OF COSMETIC CHEMISTS RELATIVE INTENSITY I00 F FIGURE I I_ X-RAY DIFFRACTION 9 0 GMS, 8O 7O 6O 5O 4O 5O 2O I0 18 20 22 24 26 28 30 DEGREES Figure 1. GMS, X-ray diffraction freshly fused RELATIVE INTENSITY I00 9O 80 70 60 50 4O 30 20 I0 0 Figure 2. FIGURE 2 FRESH GMS AS RECEIVED -- _ • 18 20 22 24 26 28 30 DEGREES 2 8 Fresh GMS as received
Purchased for the exclusive use of nofirst nolast (unknown)
From: SCC Media Library & Resource Center (library.scconline.org)